 I have recently published my first book: ‘Predicting and Trading the News’. It’s really more than just news trading, it shows how you can read the price action, at key levels, for some super R:R trades, on almost any instrument and timeframe, using whatever charting software you prefer.
Whether you use my trading tools or not, or have done my free course or not, you should find there’s something for every trader in this book. There are some great examples of trading gaps and how you can use them for predicting where price will go to. There is so much more to gaps than waiting for them to be filled. The book is available on Amazon Kindle and Google Books. I hope you enjoy reading it as much as I enjoyed writing it and, more importantly, that the simple techniques help your trading to be ever more profitable.
0 Comments
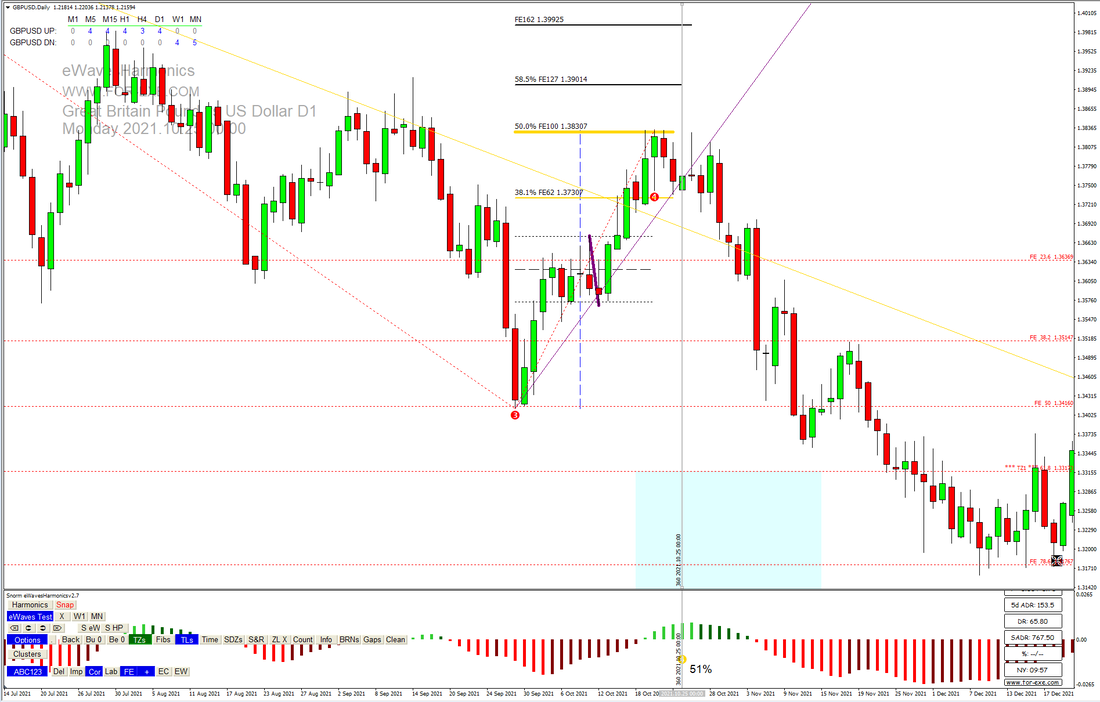 As most of you know, eWavesHarmonics with the ABC123 add-on, does a superb job of identifying potential reversal zones and high-probability price magnets, long before price gets to these levels. With thoughts for those who can’t trade all day, I’m looking at Options trading as a good alternative to regular day-trading.
I would really like to hear from the Options traders out there, to get your input and thoughts on this subject; I’m also very interested in your choice of broker (I’m trying a couple out at present) Please get in touch. Regarding the ABC123 indi: v7 is available. The main change is that it identifies, what we call, golden FE levels. Say, for example, you have an ABC simple correction with the FE100 at 50% retracement – this will be highlighted as golden; same for FE62 and FE127. These levels are highlighted well in advance and often provide a great opportunity to ‘buy the dips’ and ‘sell the rallies’ for very low pip risk and thus great R:R - as per the chart example from Cable. 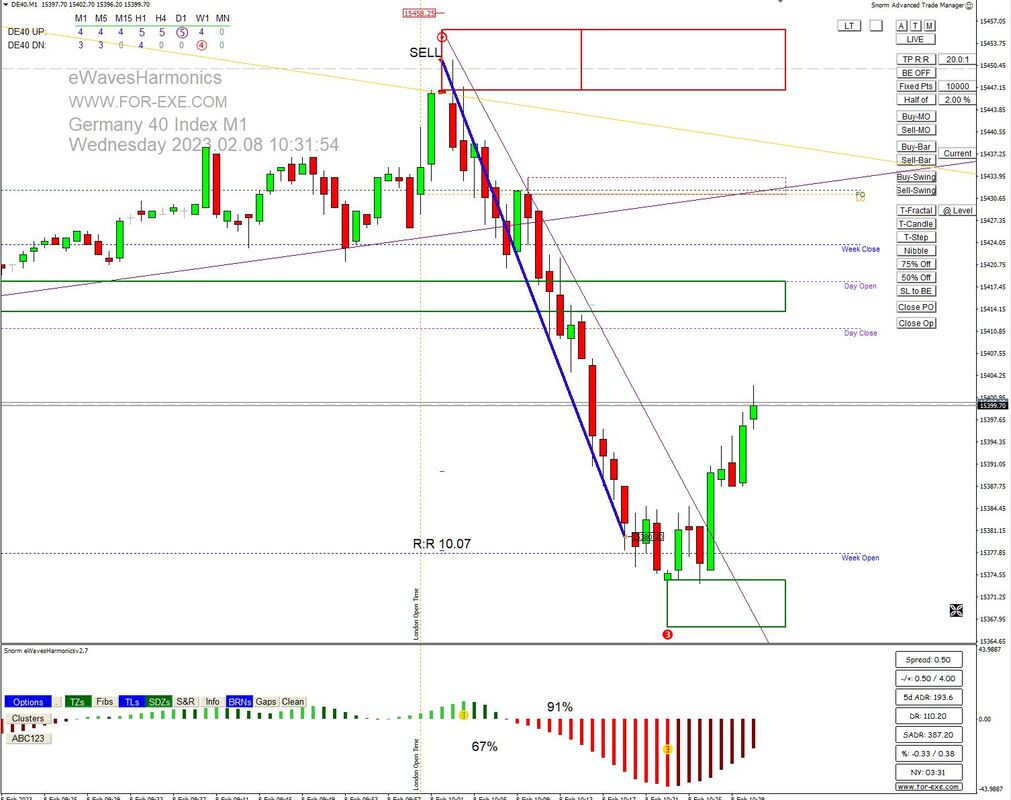 We've had countless good trades, since the last blog post, but this was particularly nice - not because it was tremendous RR, although 10 isn't to be sniffed at, but because it was called in advance and worked out exactly to plan. Knowing exactly where to enter and take profits, before price has got to the turning point, obviously makes for better trading than waiting for randomly-produced signals and not having a pre-determined strong price magnet to aim for. I posted this in our Trading Skype Group, one minute before London Open, that tells you why this was a good trade; good as in well planned and executed, not just because it was a winner ... 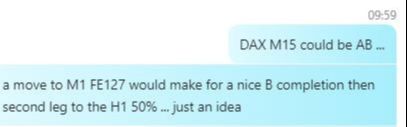 As the old adage goes: if you fail to plan, you plan to fail. Or put it another way: each and every trade needs a good plan or your chances of success are greatly reduced.
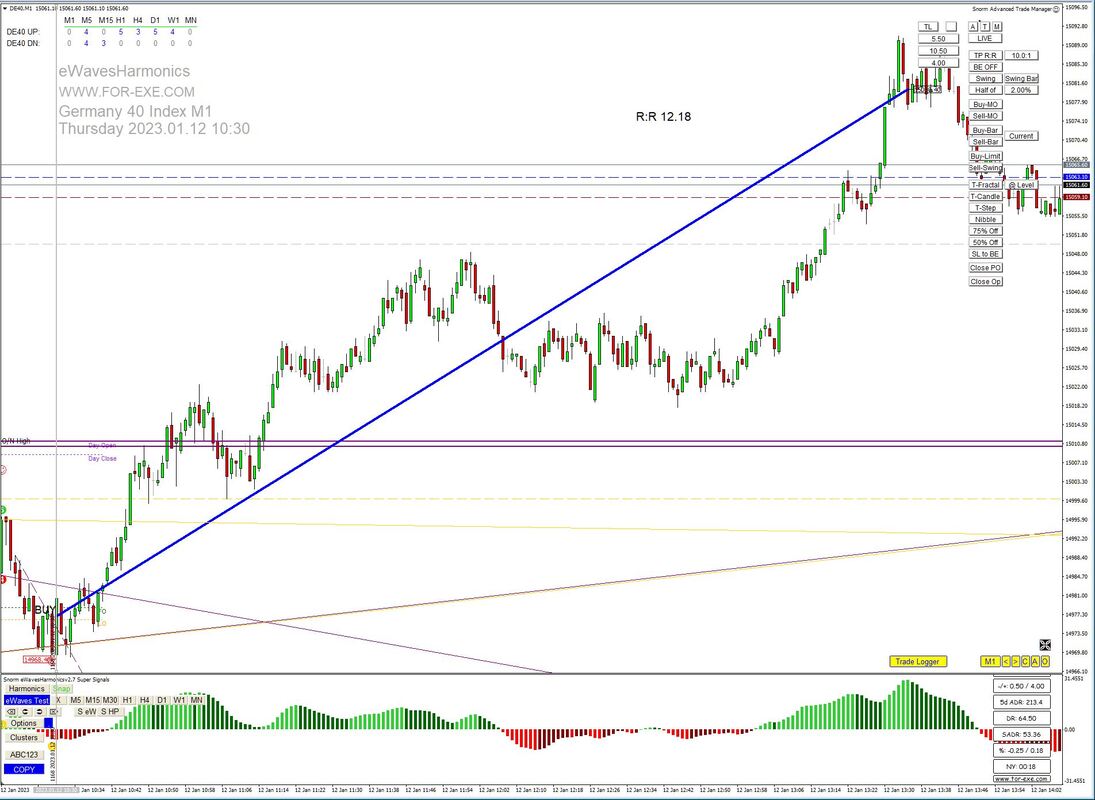 I really should have included an example, of the Trading Edge, with my last blog post; so here's a trade from yesterday on DAX, opened half an hour into the London open. This, as you can see, generated 12R and the trade was opened and managed per all the points referred in the previous post. 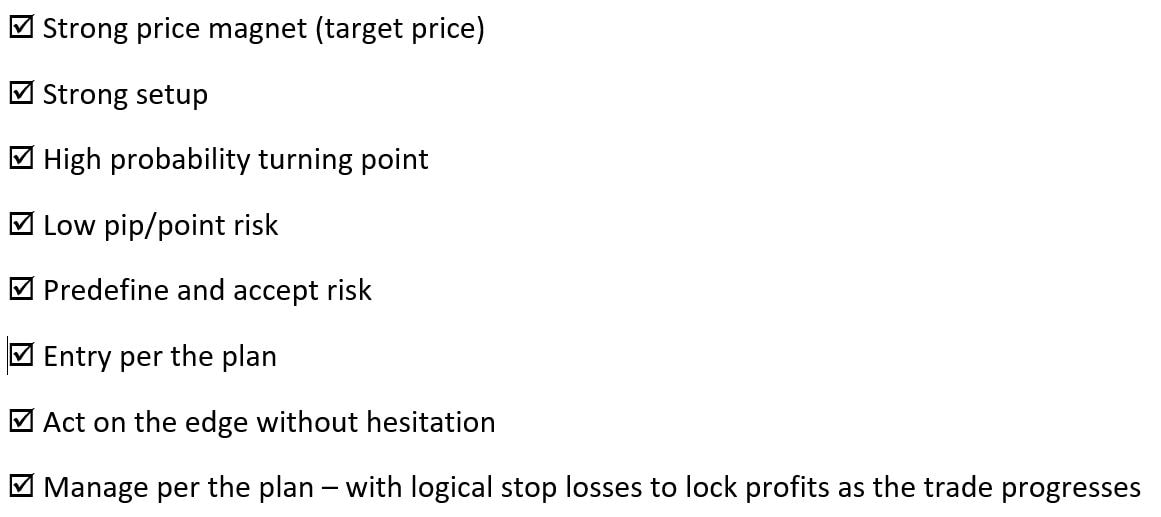 None of these points take a great deal of thought when you apply them every day for every trade. Simple, logical, methodical and devoid of emotion - plus a good deal of patience and discipline.
 Here’s a great quote, from Mark Douglas:
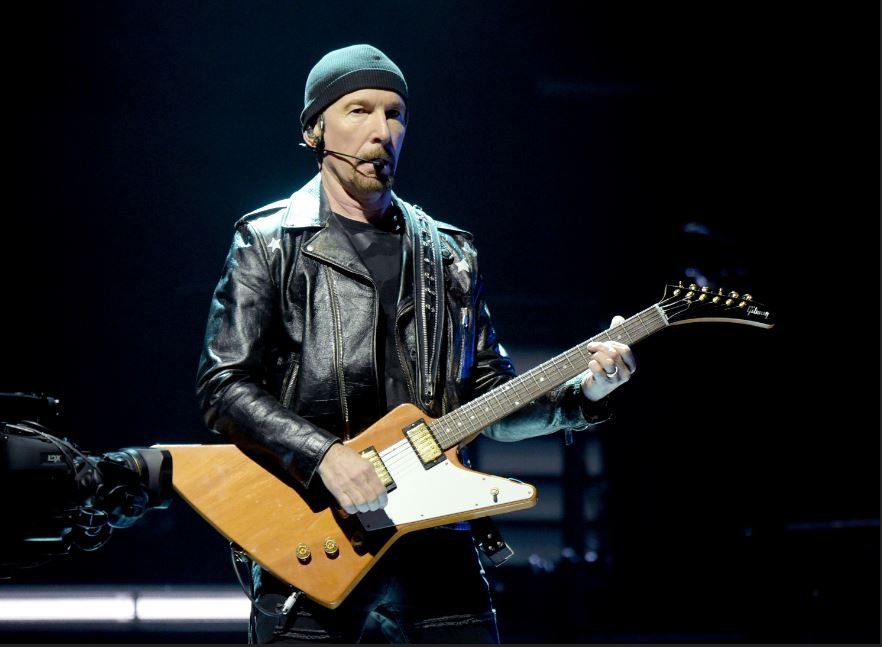
I AM A CONSISTENT WINNER BECAUSE: 1. I objectively identify my edges. 2. I predefine the risk of every trade. 3. I completely accept the risk or I am willing to let go of the trade. 4. I act on my edges without reservation or hesitation. 5. I pay myself as the market makes money available to me. 6. I continually monitor my susceptibility for making errors. 7. I understand the absolute necessity of these principles of consistent success and, therefore, I never violate them.” Great stuff, but what is an ‘edge’, as regards trading? Simply put, an edge is what contributes to you being a profitable trader: from having a good trading plan to the way you enter and manage your trades. It’s what sets you apart from most wannabe traders who struggle to make a profit. Asides from the requisite psychological aspects of being a trader – e.g. patience and discipline – the most important edge is what triggers a trade; the ‘setup’. What makes you willing to risk your money to make a profit? Your edge prevents you from random trading and helps you to focus on repeatable patterns that are proven, over time, to have a good chance of success. In our Skype Trading Group we have well over 20 different setups that give us the edge. These are setups that allow us to buy the dips and sell the rallies, often getting in at the start of Wave 1 with the lowest possible pip risk. This edge frequently generates more than 5x the risk in returns; 10R or 20R trades are less common but happen most weeks. Having such an edge helps you to accept losses with a pinch of salt, so you can keep acting on the edge without reservation or hesitation, as recommended by Mr Douglas. So, we have an edge with our setups, an edge in being able to identify high-probability price magnets before pressing the buy/sell button, an edge in being able to identify high-probability turning points that provide the ultra-low-pip-risk entries and, just as important, an edge in being able to manage a trade through to conclusion, banking excellent returns. Just knowing these things gives you the necessary confidence to succeed as a trader. If you’re struggling as a trader, set about documenting what your edges are. Again, as Mr Douglas says, you should objectively identify them, such that there is no ambiguity. Make a point of fine-tuning your edges with the experience and results of trading them. This will give you the advantage in the highly competitive world of trading. P.S. The picture? That The Edge from U2, in case you didn't know. He certainly has the edge when it comes to playing a guitar. 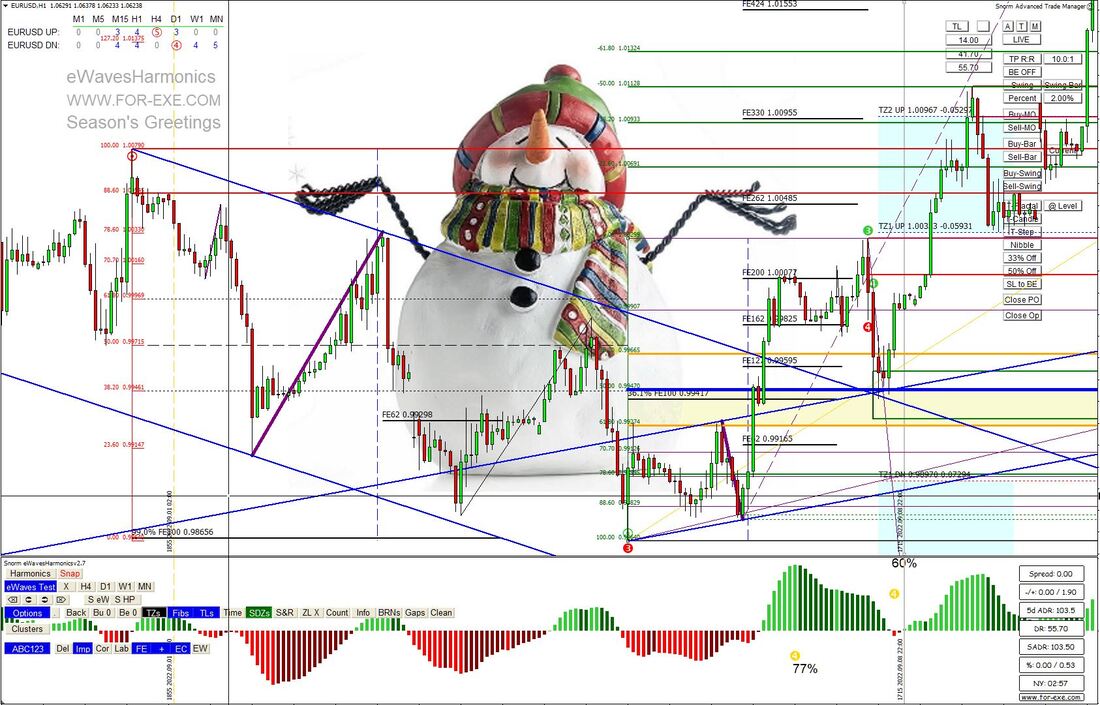 It’s that time of year already and what a year it has been – mostly one that I’d sooner forget with the Russia-Ukraine war and the terrible impact that's had on the global economy. It has, however, offered ample great trading opportunities to give us a much-needed silver lining to the dark clouds.
One aspect of trading that has been particularly fruitful, has come from trading the news. With so much focus on interest rate rises to curb ridiculously high inflation, any related-news, such as inflation stats, has had a much bigger than usual impact; thus providing super R:R trading opportunities. To benefit most from these news trades, we’ve entered seconds before the release, with a single trade and a tight stop – basically attempting to predict the news (or at least the impact of it) by just using technical analysis, as covered in the training course. There is a risk of big slippage on your stop loss but the gains have far outweighed the losses. I’m working on some material to help other traders ‘predict the news’, which I hope to release next year (gathering all the multi-TF chart examples is a long job). Something else that might be of interest to you is the Trading Decisions Flow Chart, originally inspired by Michal in our Skype Trading Group and refined with the help of other members. It’s ideal for those who like to find trade entries on the lower timeframes and is intended to improve discipline and, more importantly, your success rate. The flowchart is now available to view in the Training Course material. As it’s that time of year for giving, I’d like to offer some free bonus months on any eWH or ATM licence extensions – for existing or returning users. Any extensions/renewals/new licences purchased between today and the end of 2022 will have an extra 6 months added. Thanks again, for all your support and success stories, throughout the year. I wish you and your families a very happy festive season and much prosperity for 2023.  From chatting with the members of our Skype Trading Group, the number one reason that traders fail would seem to be: over-trading. We all know how easy it is to get into revenge-trading mode, when you’ve had a couple of losses and the trading demon takes control, urging you to take more and more trades to recover what was initially just one small loss, that grows to be multiple losses because all the discipline and trade rules get forgotten. There’s also the urge to keep on trading even when you’ve had a great session, then before you know it, you’ve given all those profits back as greed creates a loss that invites the revenge-trader back.
To always keep the discipline, I’ve written an indicator called ‘ATM Kill’. Load this onto just one chart (pick your most-traded chart) and it will apply the rules to all the charts with ATM loaded. Before a session starts (you can’t change the options during a session), you set the session start and end times, max trades per session and hour; max losses per session (number of trades, total financial and/or percentage) and max gains per session (financial and/or percentage). The indicator will flash a warning when you’re getting close to any of your limits and remove the BUY/SELL buttons, from ATM, when thresholds have been reached. Feedback from the Skype group members that have been using this indicator has been extremely positive. I’ve also written a Trade Analyser that shows your best/worst trading by day of week / day of the month / hour / instrument. So, if you see that your worst time for trading is around the New York Open, for example, you might like to skip that hour altogether, in future, or create some specific rules to improve your chances and limit your losses. These are free add-ons for the Advanced Trade Manager, available for download now from the installation page. I hope these tools will help you to become an even better trader. 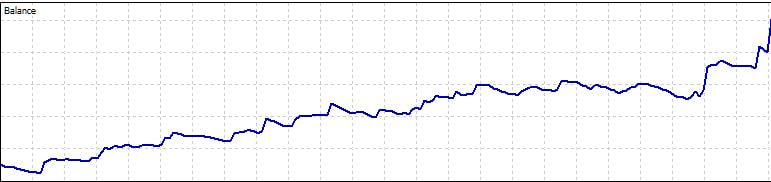 I set myself a challenge, at the start of September, to see if I could double a trading account in one month, with the fewest trades that I could get away with: I did that yesterday, a few trading days ahead of schedule.
This isn't a" blah blah look what I can do blog post" (ok, perhaps it is just a little) - there are a few key points that I wanted to make, as discussed in our Skype Trading Group. I used my Trade Copier for this account - taking my usual trades on my primary account and copying them to a second account. Why? So that I can switch off the copier when my targets for the day had been done, in terms of profits or losses. I had a few user and technical glitches as I was working on the copy code, which have since been fixed, so there were more trades than I would have liked, but the end-result was still good. The most important point is that this is conservative trading (with a consistent 1% risk), so when I felt I'd had a good trade or session, I switched off the Trade Copier. The idea is to average a 5% return per day - the ideal approach to doubling your account in a month. If I did that 5% and a trade was still open, I'd switch off the copier and lock in tight with a manual trailing stop. I'd also switch off if I had a few losses in a session - some sessions can be complete shit, no matter how good a trader you are. There were many days where my gains on the copy account were much less than my main; some days the reverse was true. 5% a day, or 5R, really isn't that hard to do when you're getting your entries on the M1 timeframe but targeting a higher timeframe price magnet. The key, as always, is waiting for the AAA+ setups, to buy the dip or sell the rally, to get you going to your desired price target. It's an even easier thing to accomplish if you're only taking trades that offer a minimum of 5R, as is the golden rule in our trading group. A key point that needs stressing: at no time did I take partial profits. I know many yet-to-be-successful traders who do that – it’s really not a good idea. Manage your stop losses with logic, not fear of loss. Don't let the naysayers tell you that retail traders can't make terrific profits because the big dogs can only do 10% a year. Master your discipline and the trading will take care of itself. All trades were on DAX and DOW in the London morning session; DOW and NASD in the London afternoon (NY morning) session. I'd like to give a special shout out to the guys in our Skype Trading group this morning, who had some really nice trades, open and closed in about an hour and all making super profits. It just goes to show what any trader can achieve when working together and keeping a simple approach to looking for low pip/point risk entries. The simple approach, as I've blogged about before, is to identify a high probability target from an impulsive move, then look for the subsequent correction to end, so we can jump on board ,as early as possible, to get into the next impulsive move towards that target. You can aim for the high probability target with a set-and-forget or, as we tend to do, lock some nice profits when they're available and either walk away, for the session, or look for another corrective move to get you back into the money flow. Pigs do tend to get slaughtered, as I discovered when I took only 7.5R from a 25R trade yesterday morning, but it's nice to shoot for the big ones from time to time (I was looking for a crazy 50R in that instance, from a 3 point SL on DOW). Here are the trades, from just some of the traders in the group, to show that we're working together for the entries and trade management.. Well done to Jo (10.5R) , Ray (6.3R, 4.6R, and 3.3R), Michal (8.3R) , Peter (4R) and everyone else in the group - a great bunch of guys and always a pleasure to trade with.. My two trades also shown below. (9.5R and 7.5R) For these trades, we all used: eWavesHarmonics, ABC123 indi, Sessions Indi and, of course, ATM for trade entry and management. 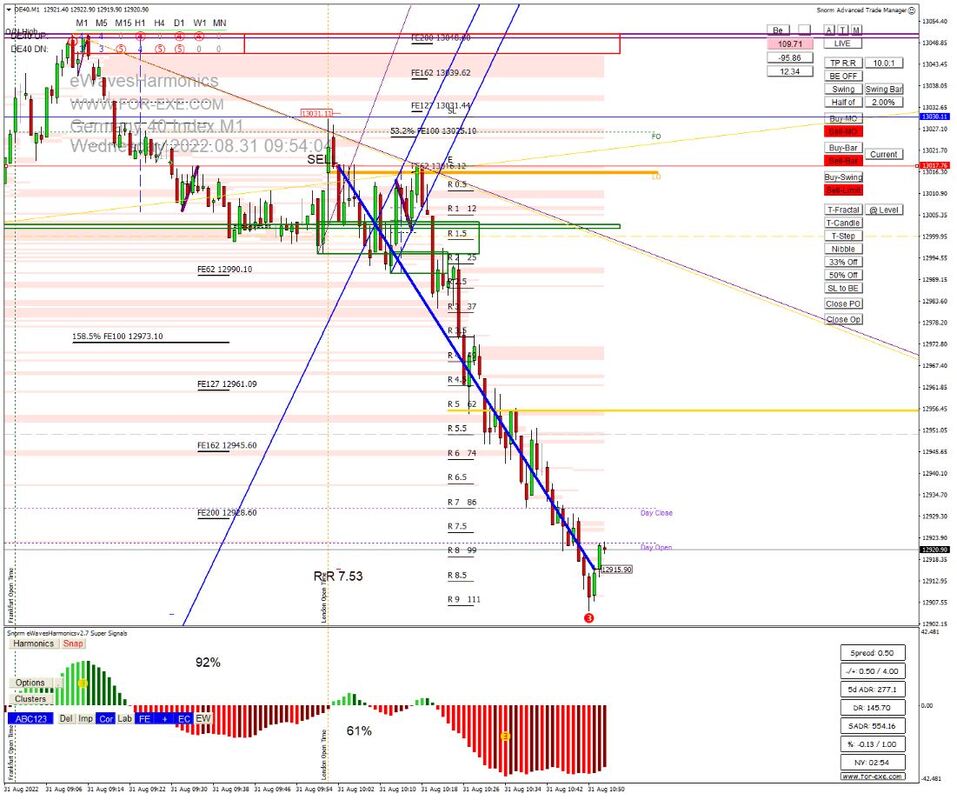 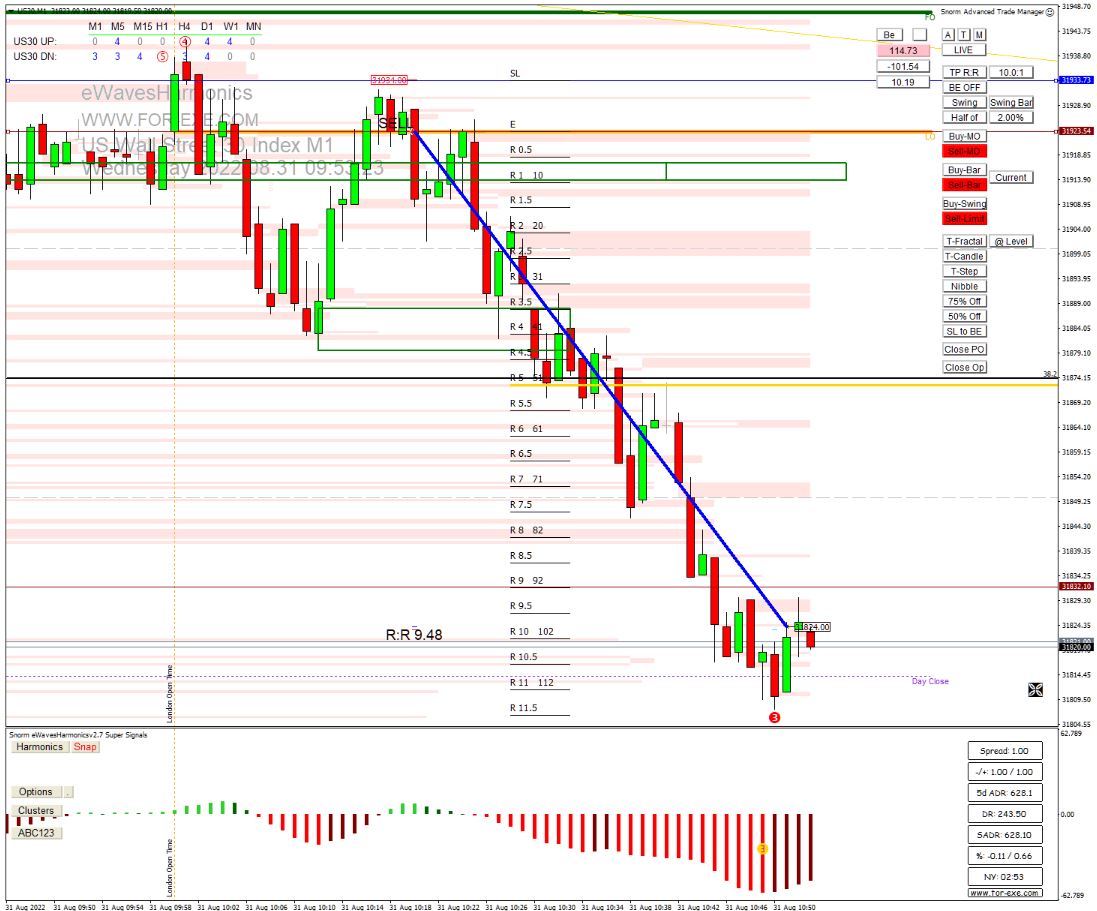 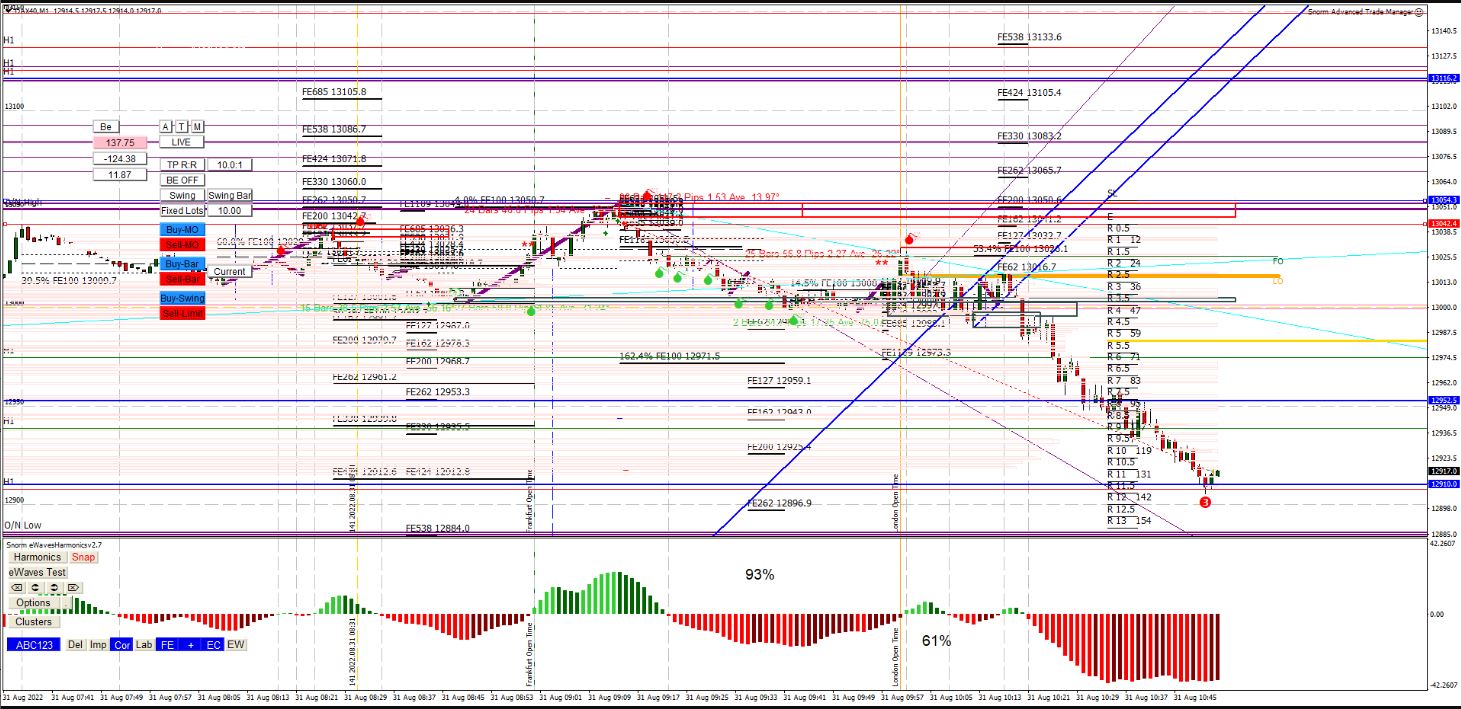 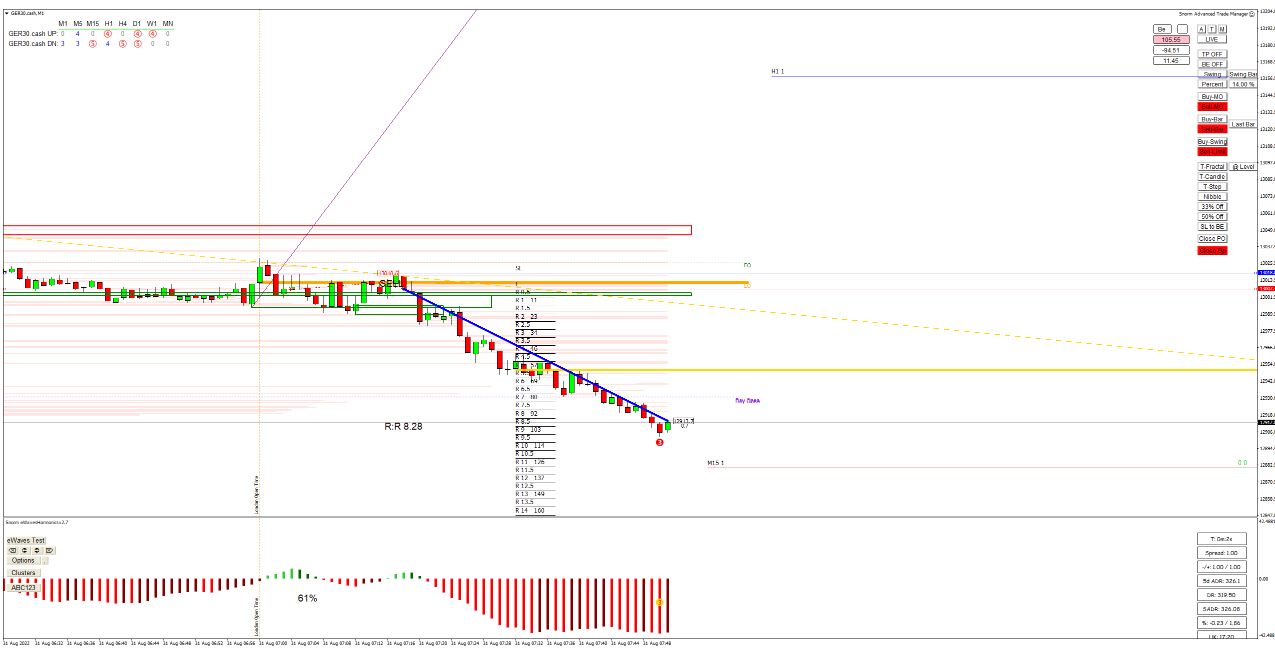  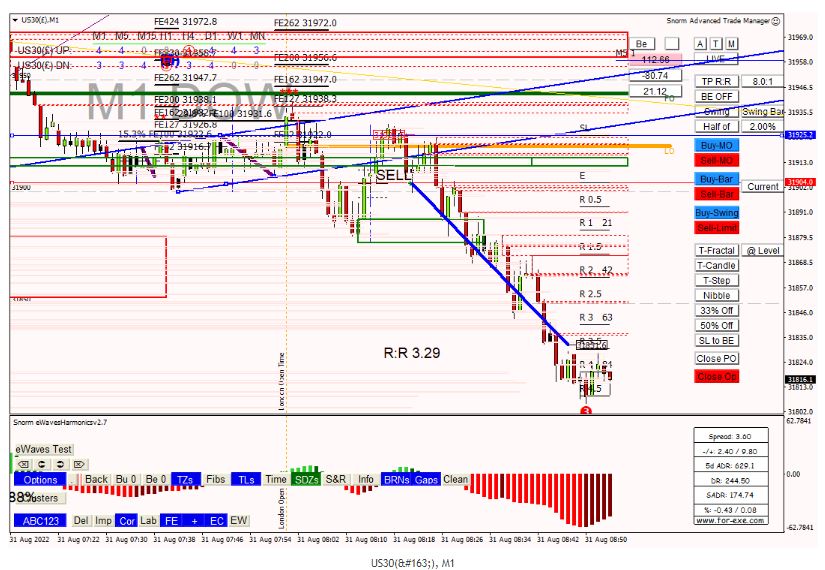 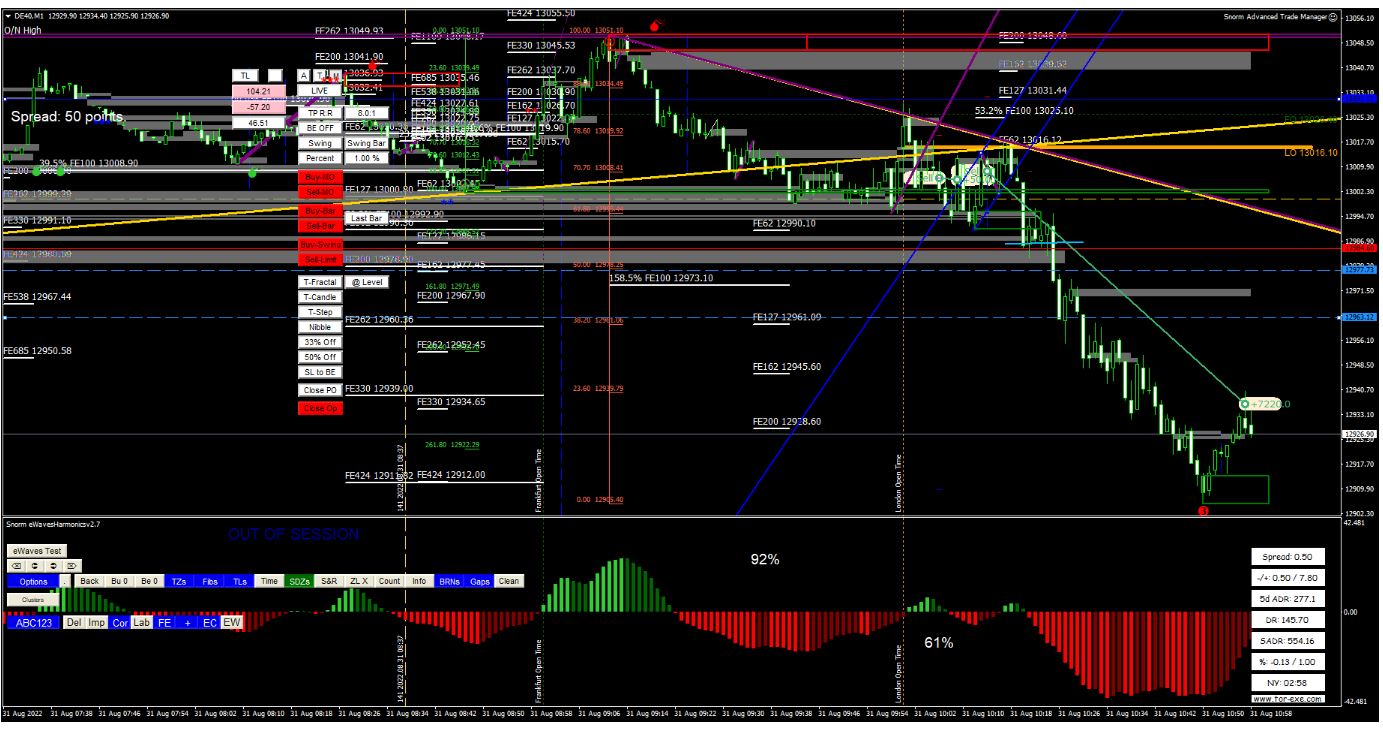 If you'd like to know why we do these types of trades, it's all in the (still FREE for ATM and eWH users) Trader Training Course.
 There have been a few times when I've not been able to see the ATM 'Swing Lines' due to other lines being in the way, making it difficult to select and move them. Since using the Swing lines is my preferred method of entering a trade with a very tight stop loss, I was compelled to make an urgent change - one that I should have made some time ago. When the Swing button is selected for the initial stop loss (as opposed to Fixed Points or Bar) a new button is available: "Swing Bar". When pressed, that button will bring the Swing Lines to either side of the current bar and leave them fixed there (not automatically moved when new fractals are formed). To revert back to fractal-based swings, just cycle the stop loss button back to Swing.. To later move the Swing Lines to the latest bar, just hit the Swing Bar button again. The updated ATM is available for download from the installation page. Entering with low pip/point risk trades is now even easier and quicker. I hope you find this new feature useful. Please let me know if you have any more suggestions for improvement. 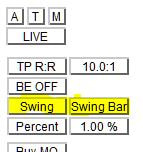 |
Archives
May 2024
|
 RSS Feed
|
Website design by Snorm
|