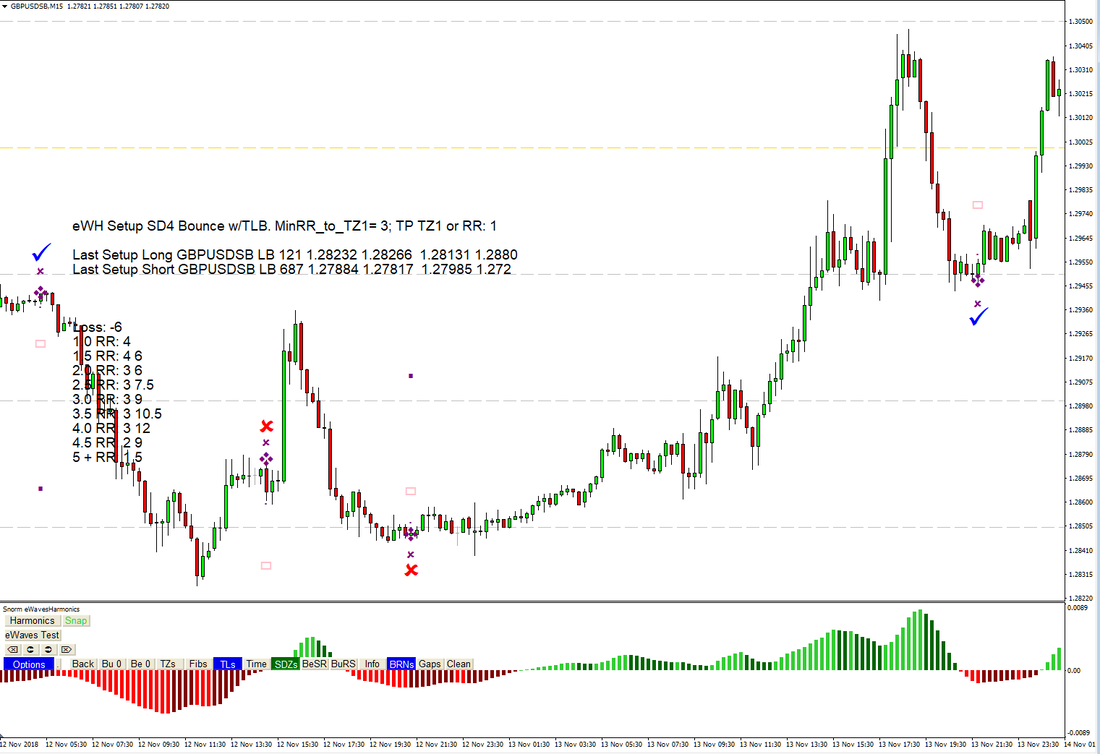
 We all want trade signals that alert us to high-probability trade setups, removing the need for in-depth analysis of the many variables that yield profitable trades. There are hundreds, if not thousands, of so-called ‘trade signals’ available from scammer sites - with false claims of guaranteed success – but they offer no easily-verifiable statistics to support the claims of greatness. I get many requests for trade alerts or buy/sell signal indicators and, over recent months, have been working hard on some ideas; It’s no easy task though. As traders, we consider some, or all, or more, of the following variables: trends (although I dislike that term – more on that in another blog post), support/resistance; supply/demand; time of day; higher timeframes; lower timeframes; fundamentals – including news releases, recent and planned; most-recent price bars; relatively-recent price bars; trend lines; gaps; patterns of all types and shapes; symmetry; balance; projections (time and price), Fibonacci levels, wave counts; etc. And … let’s not forget the plethora of technical indicators that could form a part of the decision making. The human brain, trained from years of charting, can do this in seconds, or less. Programming a computer, to consider all (or, at least, the most relevant) of these variables, is a considerable undertaking. The fewer of the aforementioned variables that are considered, the more random the trade signals will be – likely yielding, at best, a break-even success rate. Getting good trade alerts is just half the job. In addition to entries, we need to know where to put our stop loss, where to take profits and how to manage the trade. An alert on its own is useless, if you don't know what to do with the trade or what the best place to take profits is. With eWavesHarmonics (eWH), we have visual representations of, what I consider to be, the most important trading variables: the technical elements that I look at for trading, plus some extras for those that like them. Presented with the many critical elements of technical trading, on the chart in view, our brains can easily focus on good setups. So, it goes without saying, that eWH is my focus for the trade signals and there are a myriad of options and setups to choose from. Currently being tested is a setup, that anyone who has done the free trading course should know: SD4 bounce after a W4 TLB. This is a logical approach to finding the end of a correction and getting a high RR trade. The picture, at the top of this post, is an example from GBPUSD M15 since 1st October: The blue ticks shows successful trades, reaching the minimum target of 1R.; the red cross shows losing trades (the first would have been avoided, when manual trading; the second one was only just stopped out). Putting eWH into Test mode, I let the chart auto-scroll and the setup indicator records how many wins/losses and what RR could have been achieved. In two months, you could have ‘blind-traded’ (i.e. not given any thought to other factors) this particular setup: 10 trades, 6 losses, 3 x 4R wins for a net gain of 6R … that’s very acceptable. Would the average trader, who wants to blind-trade, be happy to suffer 6 losses and only 3 x 4R wins though, even if the overall returns were very good? I suspect not, so now I need to code some of the extra variables that I would consider before trading this type of setup, then run more tests: across multiple instruments and timeframes. I’ve done some recent testing using customised and well-known harmonic patterns for eW4 corrections (anyone with eWH can do this for themselves, if you don’t mind manual-recording). I’ll give you a clue, from my automated testing, as to which patterns make for the best end-of-W4-correction trade alerts: Bat, Gartley and quite a few of my own custom patterns. I don’t trade with harmonic patterns but if they can provide reliable trade alerts, while I’m not watching the charts, then they’ll have a place in my trading plan. I'm making slow progress with the trade signals and will keep you posted when I have something good to share. In the meantime, it’s far better to trade with the Mark 1 Human Eye Ball indicator (any bets on how many emails I’ll get asking for that indi ?).
14 Comments
 The Trade Levels Indi, free for ATM users, has been updated and is available for download from the ATM folder. New features: -
A few of us have been using this for a couple of weeks and feedback has been very positive. Great traders look for great R:R opportunities - this indi is designed to help with that endeavour. |
Archives
May 2024
|
|
Website design by Snorm
|


 RSS Feed