 The Support and Resistance function, in eWH, has been complete reworked to show the levels as I would draw them manually. One button has replaced the previous two, providing levels from one or more timeframes, using your defined parameters. In addition to a predefined number of bars, in which to find the S&R levels, you can also select additional areas from historical data - particularly useful if price is making new highs or lows By default, eWH looks at candle closes but you can change this to wicks, if you prefer. This short video shows how it works ...
0 Comments
Chris has been using eWavesHarmonics and the Advanced Trade Manager for about two years and has enjoyed the Trader Training Course. I hope that you'll get some inspiration from seeing how others are trading with eWH and what they've learned from the course.. Please send me an email if you would like to contribute as well - it's always a pleasure to read and share the many success stories. Many thanks for your contribution , Chris. We all did it or are still doing it… jumping from one trading strategy to another looking for the ‘Holy Grail’ and believe me I’m the guiltiest of them all trying to find that winning strategy. Sometimes the best strategy has been staring you in the face for months or even years and you’ve totally disregarded it. One of the best strategies around and one which I have been back testing and trading over the last few months is the TLB (Trendline Break) I’ve found the TLB especially on the higher timeframes to be an excellent strategy to have in your arsenal. eWavesHarmonics makes trading the TLB easier with its automatically drawn trendlines, supply and demand zones, TLB alerts and KEEP function. Below are a couple of examples of TLB’s that I traded from Wednesday last week. XAUUSD – H4 TLB Price has broken the W4 Trendline at a Supply zone and 38.2% Fib retracement on the 4hr timeframe. 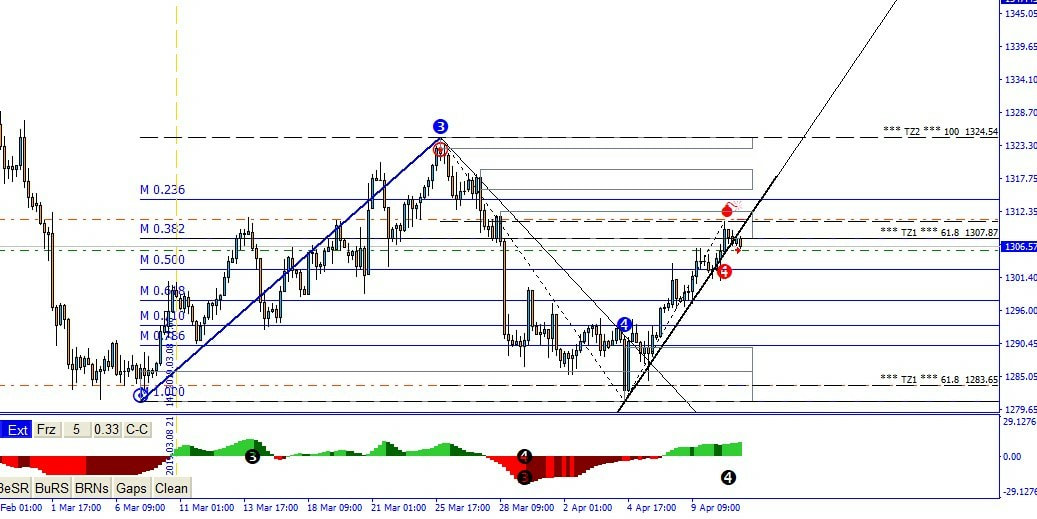 We edit the name of the trendline to include ‘KEEP’ and switch to the 1HR timeframe looking for the re-test, once re-tested we place a SELL stop order below the candles after the trendline. 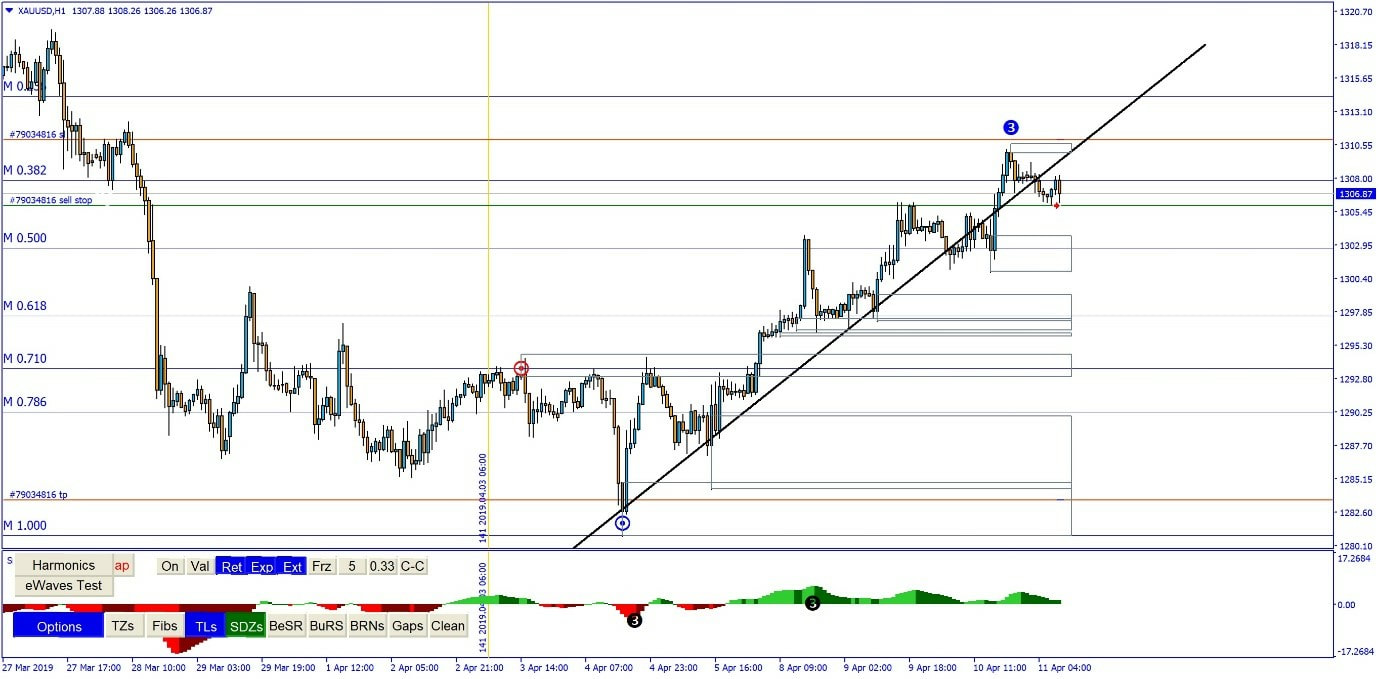 I’m targeting TZ1 on the 4hr timeframe for my TP moving my Stop along the way, with an initial R: R of 4.4:1 This is how it’s played out so far, I think there will be more downside to come and I fully expect it to hit my TP however, if not, I’ve banked profits so I’m happy. 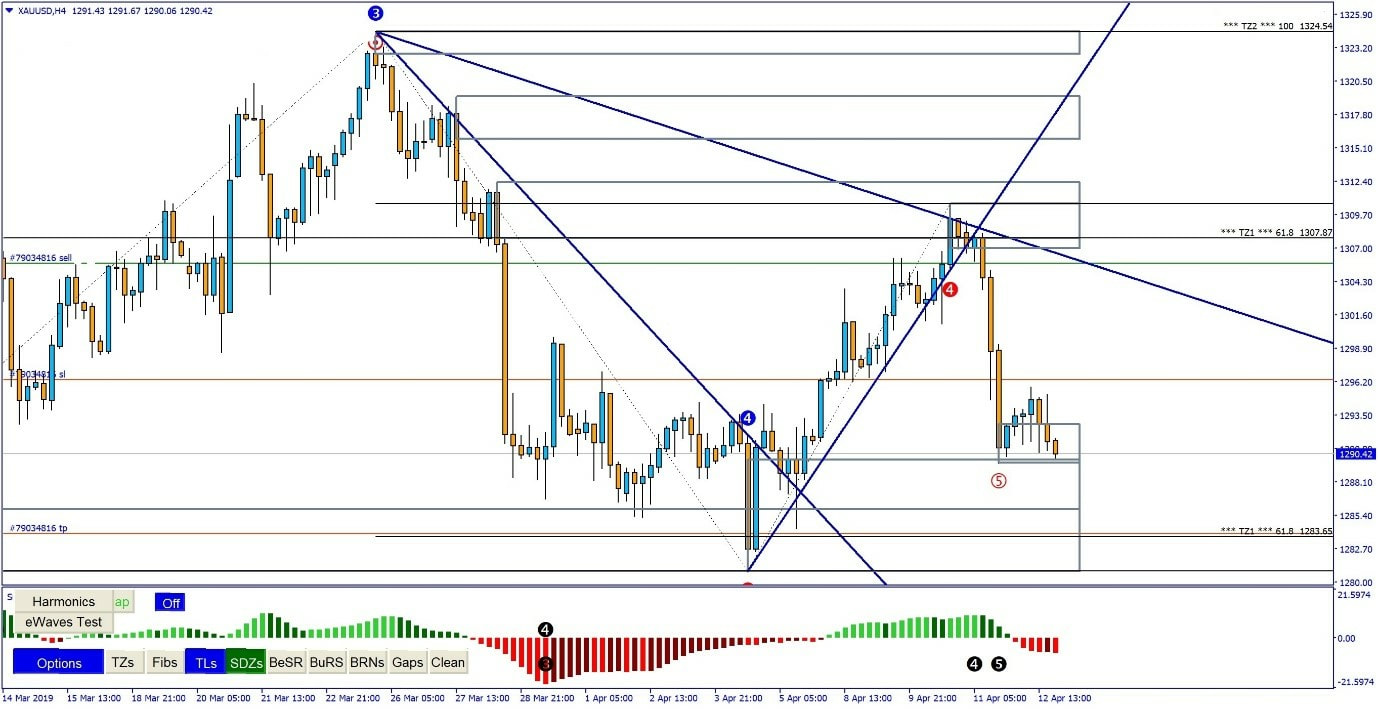 EURAUD - H4 TLB The same trade as XAUUSD above. Price has broken the W4 Trendline at a Supply zone and 38.2% Fib retracement in addition we also have a shooting star candle further rejecting the supply zone on the 4hr timeframe. (The below screenshot may look a little strange as my stop is already below the sell price however I forgot to screenshot this trade and I’m using the Candle Hider indicator (another For-exe.com goody) 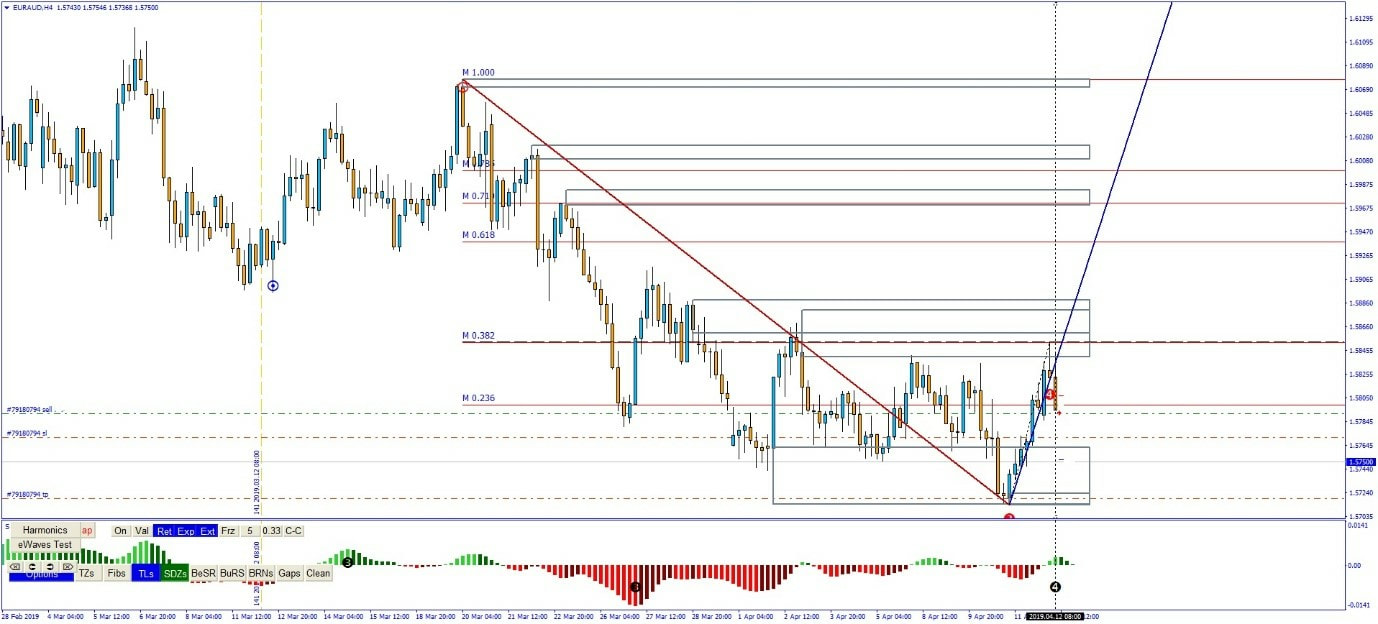 Again, we edit the name of the trendline to include ‘KEEP’ and switch to the 1HR timeframe looking for the re-test, once re-tested we place a SELL stop order below the candles after the trendline. The only difference with this one is price only really re-tested the supply zone as the breakout was a big bearish candle. 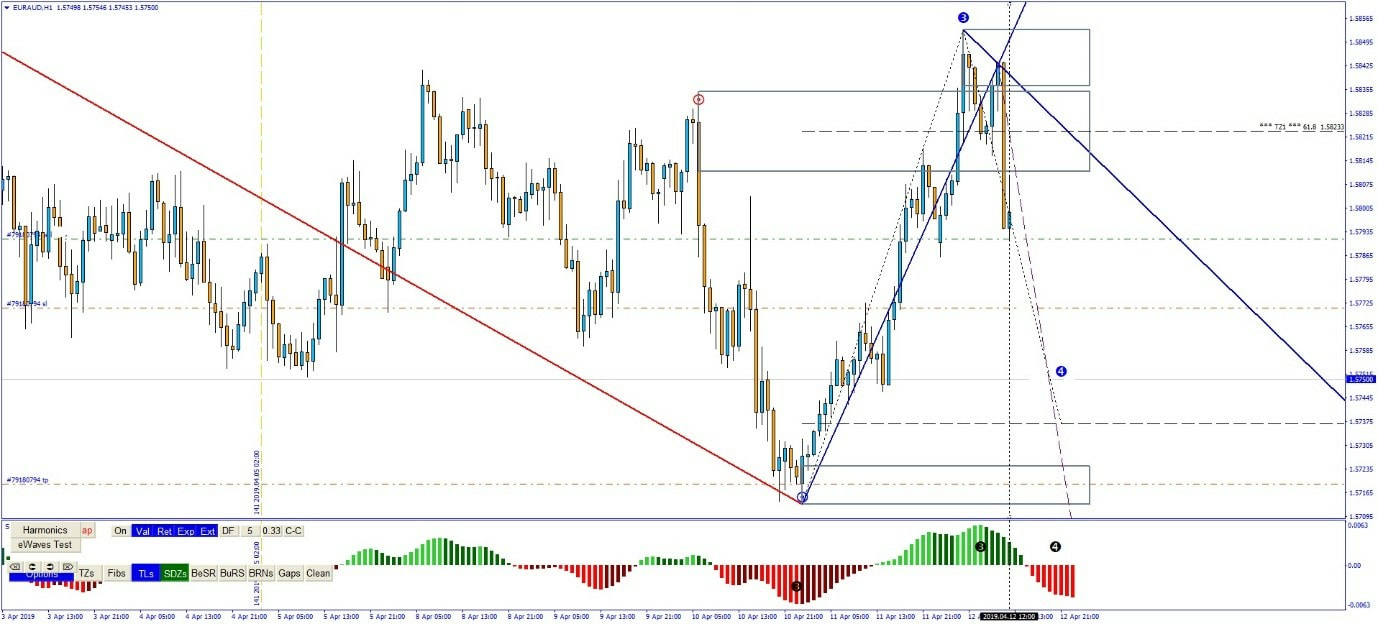 I’m targeting the demand zone for my TP moving my Stop along the way, with an initial R: R of 4.6:1 This is how it’s played out so far, again I think there will be more downside to come and I fully expect it to hit my TP, as before profits already banked 😊 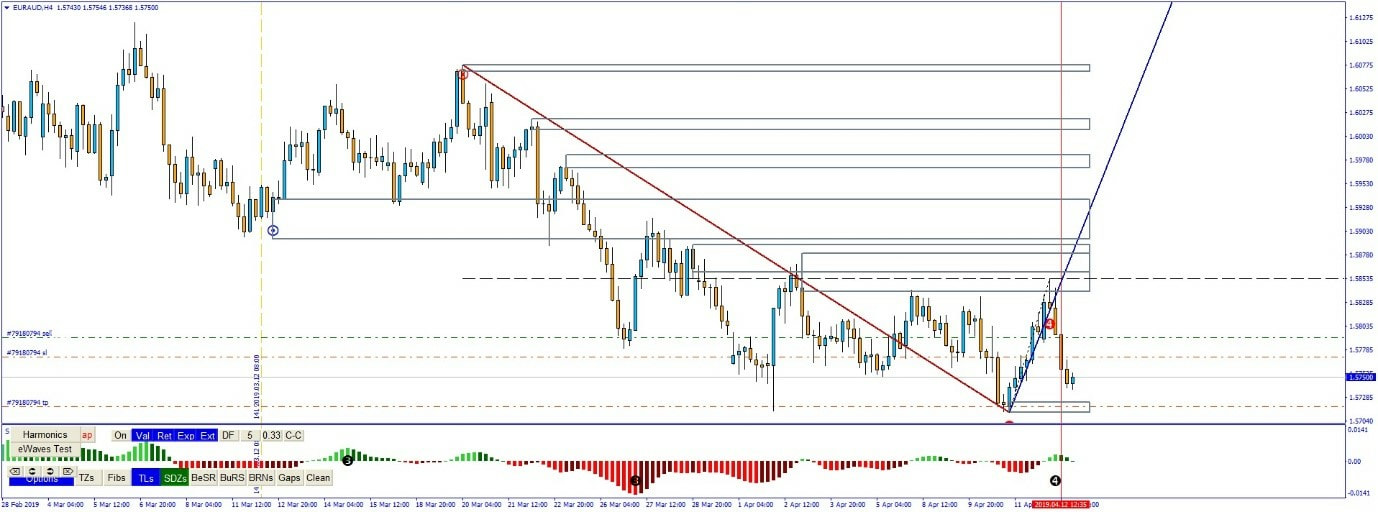 In summary, even if you think a strategy is not working keep at it and keep back testing making tweaks along the way, if you keep changing your strategy you are basically having to start the learning process over again. Master your strategy and the trades will become second nature to you and your success rate will improve dramatically. The two trades above were taken over two days, RINSE and REPEAT!! 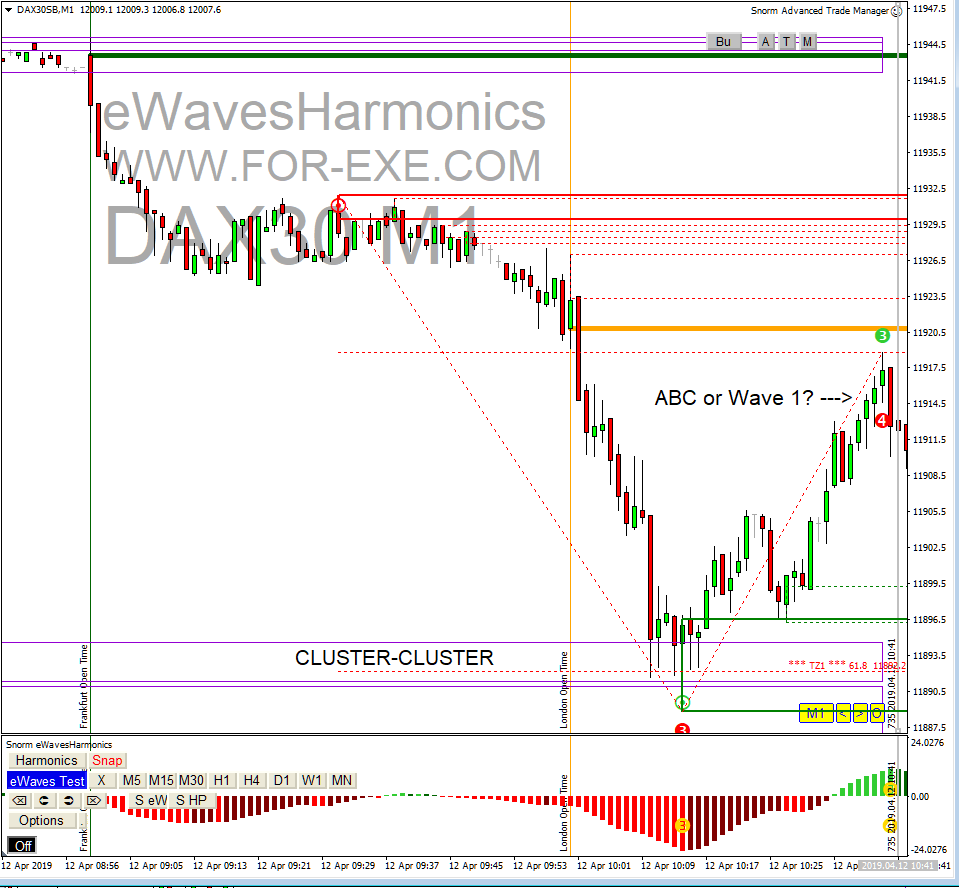 Is that an ABC correction or a new motive wave up? This is the sort of question that we traders will be asking ourselves all the time. Get it right, and you're at the very start of a big move; get it wrong, and you have a losing trade - but that's a trader's life. Sometimes we just have to make a judgement call, to get a nice trade. Looking at the chart, you'd rightly say that price has been in a down-trend since the Frankfurt Open (the green line at the top of the chart) and that the bears are still there after the London Open (gold line).. So, surely this last move up must be an ABC correction? Before deciding, you need to have a bigger picture in mind. The H1 chart provides that bigger picture, for us M1 traders, and before the London Open we already had the H1 blue TZ1 in mind for our longer-term target ... we're looking for an opportunity to go long. When price hit the cluster-cluster that had been drawn the day before, using the recent H1 moves, we had a good idea that a base had been found. The move that followed looked very impulsive - are the bulls now in control? This is what followed ... 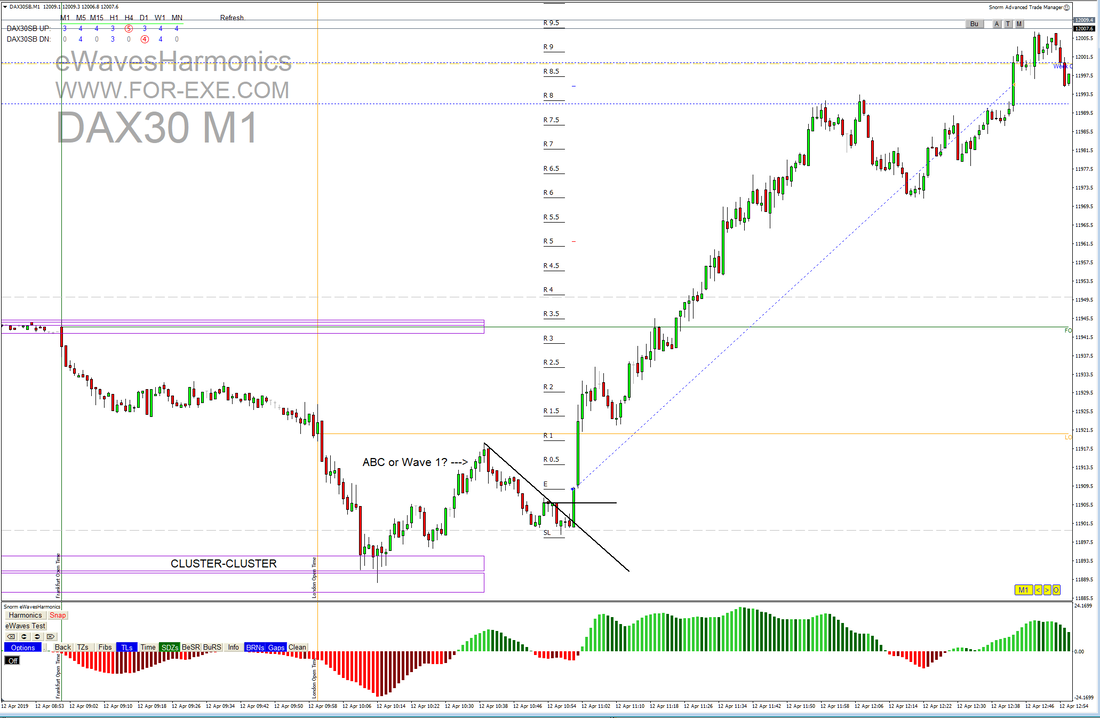 Price corrected, gave us a TLB, broke the last swing of the correction and didn't look back. I was a bit surprised to see the FO supply zone broken so easily but we knew that once that had been dealt with, we have a good place to lock profits and let the trade run. I had to go out for the day, so set my TP just below the BBRN and left price to do its thing - a nice +8R return for when I got back, late afternoon. Nearly 12R was on offer, if you stayed with the charts to manage the trade to its conclusion This trade, from the start, was discussed with some trading friends and I know I'm not the only one that benefited from that terrific move on DAX. By the way - there has been another update to eWH this week, to keep gaps on the chart that were only just closed. This enabled some of us to find a long trade all the way down here (red arrows) ... 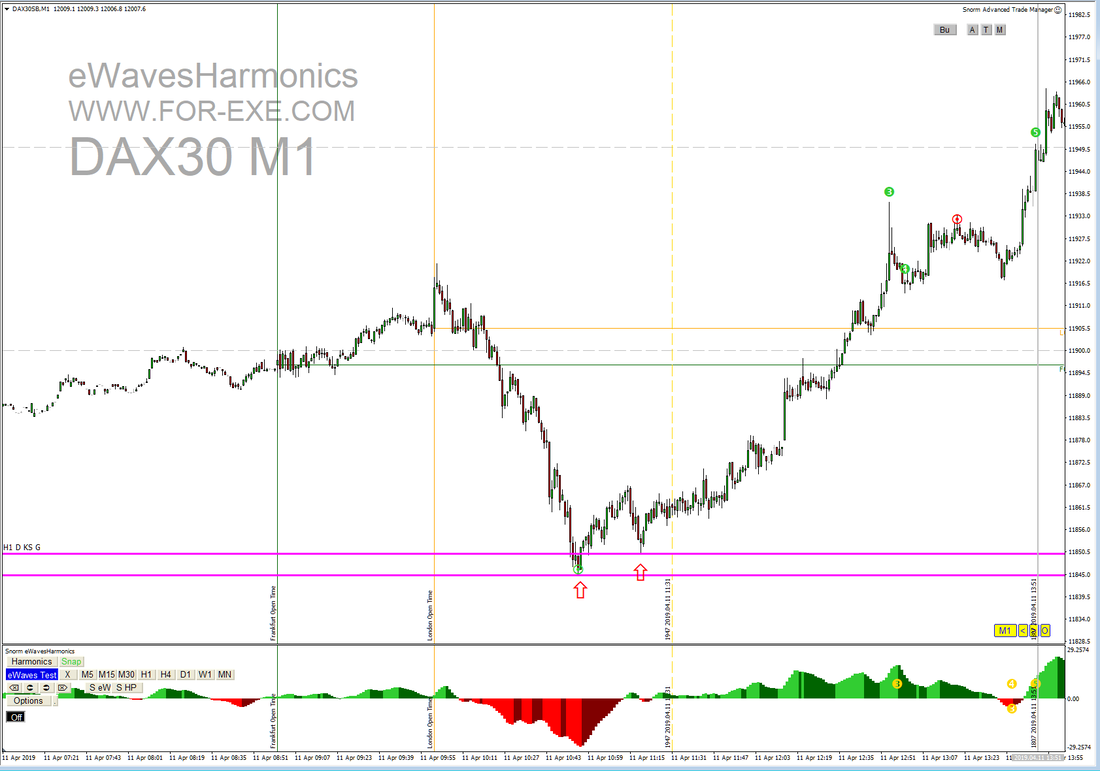 I'm often asked how to get in at the start of eWH 3 ... well here are just a couple of examples, on DAX M1 this week. You have to make that call: "is it an ABC correction or a Wave 1?". Look for solid support/resistance, have the bigger TF in mind, fill your boots. Trading is made easier with eWavesHarmonics and the Advanced Trade Manager; check out the Trader Training Course to learn how to find these trades on any timeframe.. |
Archives
May 2024
|
 RSS Feed
|
Website design by Snorm
|