|
If you have a current eWavesHarmonics licence., you might like to download this free indicator from the eWH Shop (link on the installations page). - it won't work without eWH.
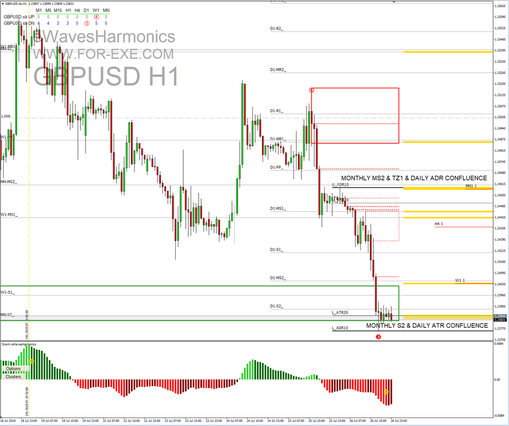
The Snorm Pivot Confluence indi, draws daily, weekly and monthly pivot levels, along with daily ADR and/or ATR levels. It then looks for confluence of those levels plus any others that you have on the chart, such as: eWH target zones (including the multi-timeframe TZs that the Wave Finder plots), support and resistance, fibo clusters, or your own manually drawn lines. As you can see from the above picture, bold yellow lines are drawn where levels align; you can choose a differnt colour if yellow isn't your thing. Seems like the bottom yellow line was enough to stop the collapse of cable for the week. If only it could stop Boris Johnson dragging the UK towards a no-deal Brexit :)
0 Comments
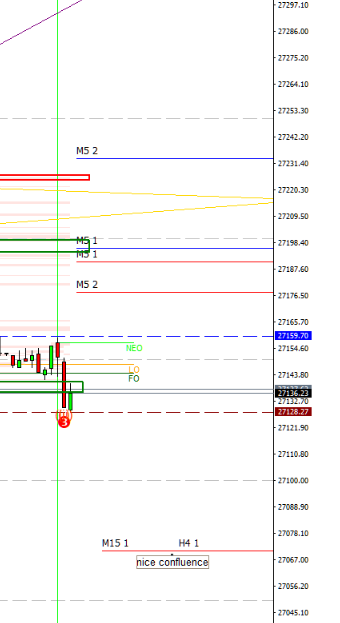
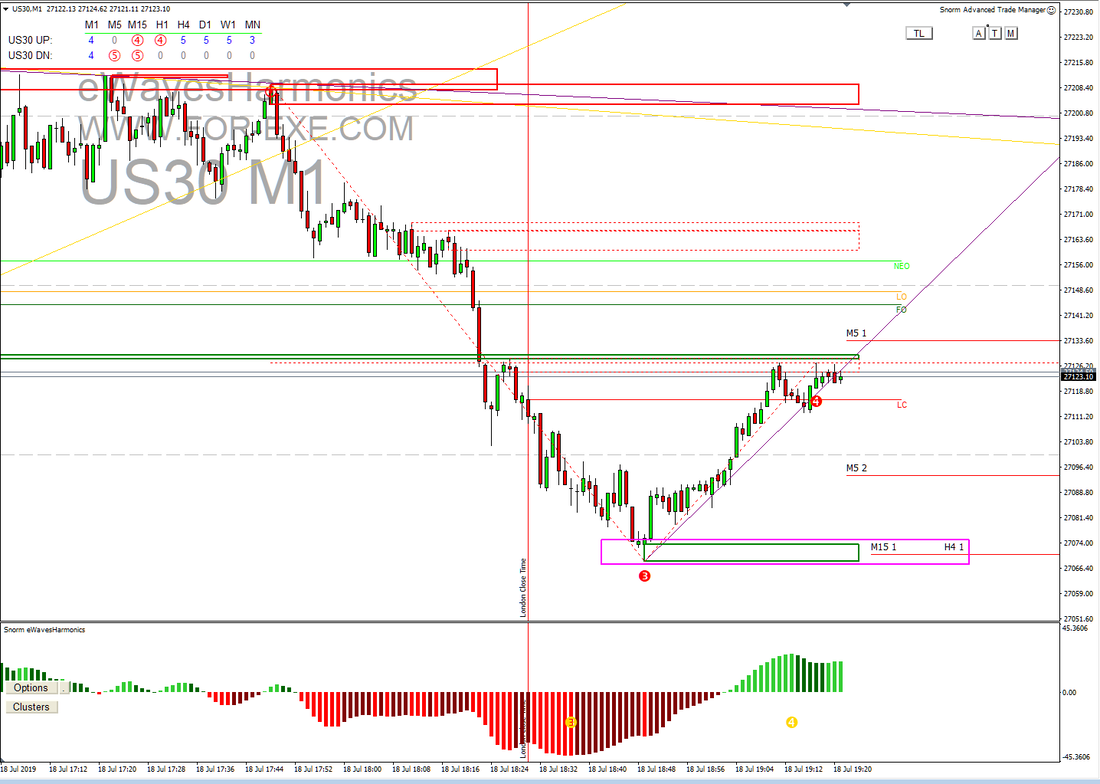
There was a terrific example of the Wave Finder working on DOW today, looking for confluence of Target Zones. "M15 1" and "H4 1" are the auto-plotted target zone 1 from the 15minute and 4 hour charts, shown here on the M1 chart. Combined, they make a very nice price magnet and possible area of SR - in this case, the H4 was a previous bullish TZ; the M15 was the bearish - in exact alignment. What happened when price got there ... An instant reversal, offering a very nice R:R trade, for those brave enough to take it.
See June blog post for more info. |
Archives
May 2024
|
|
Website design by Snorm
|


 RSS Feed