|
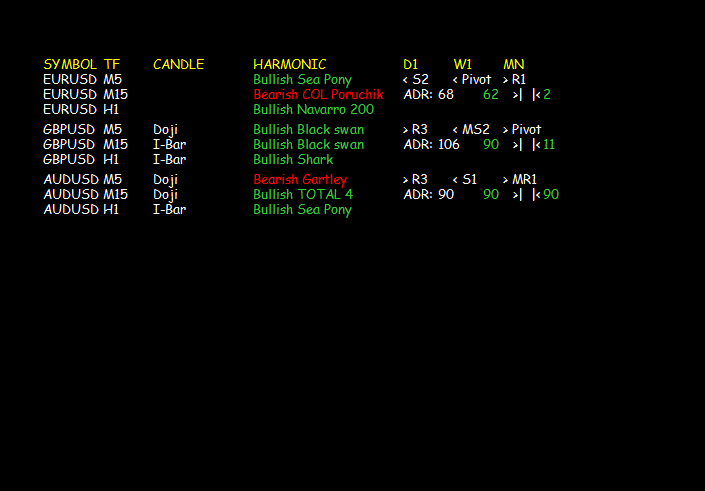
A draft-release version of the Harmonic Dashboard, based on ZUP, is available here
I will update this indi when time permits and make it available on this website - but please do have a play with the one on Forex Factory in the meantime. This is what it should look like - you can load as many pairs as you like, this example shows three ...
1 Comment
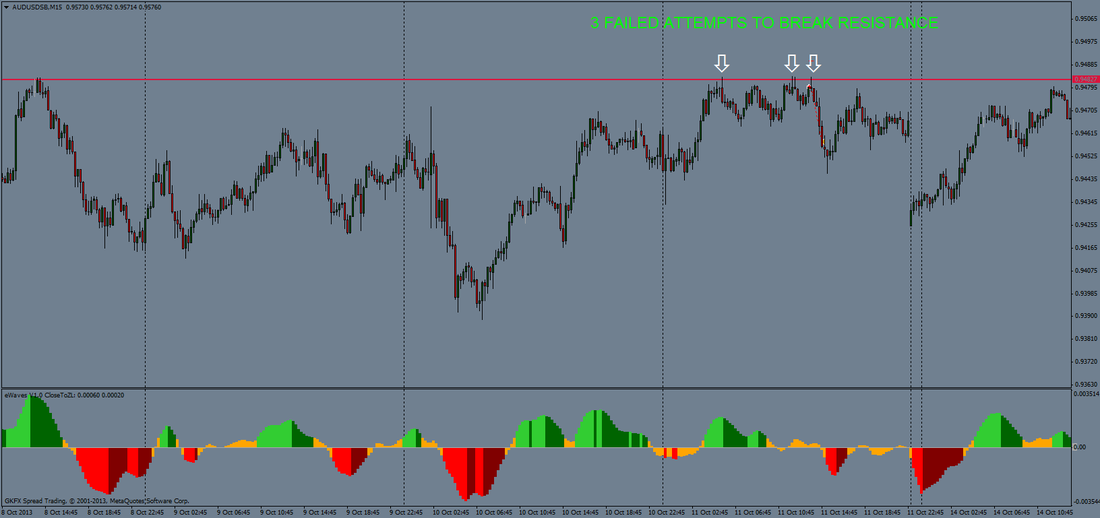
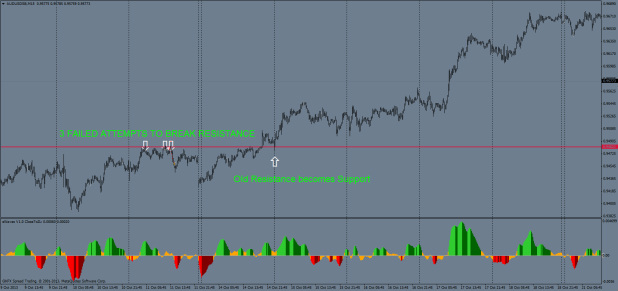
A very good trading friend of mine has had a bad trading week, as we all have from time to time. He is one of the most competent traders that I know but was kicking himself for his bad results. When we have bad days or weeks, the best thing to do (in my opinion) is look back at the good trades to reaffirm your own abilities as a trader. After sharing this advice, I thought I'd have a look at some of my own trades, for this month - this one is a good example of simple price action trading. AUDUSD, 8th Oct, had clear resistance around the 0.9482 level. On the 11th Oct, price made three attempts to break that level but there was obviously more supply than demand. I traded the pin bar on the 3rd attempt. When resistance or support holds price for several attempts, you know that when it does break it should make for a good trade in the opposite direction. I don't trade at midnight but wish I'd been up for this one ...
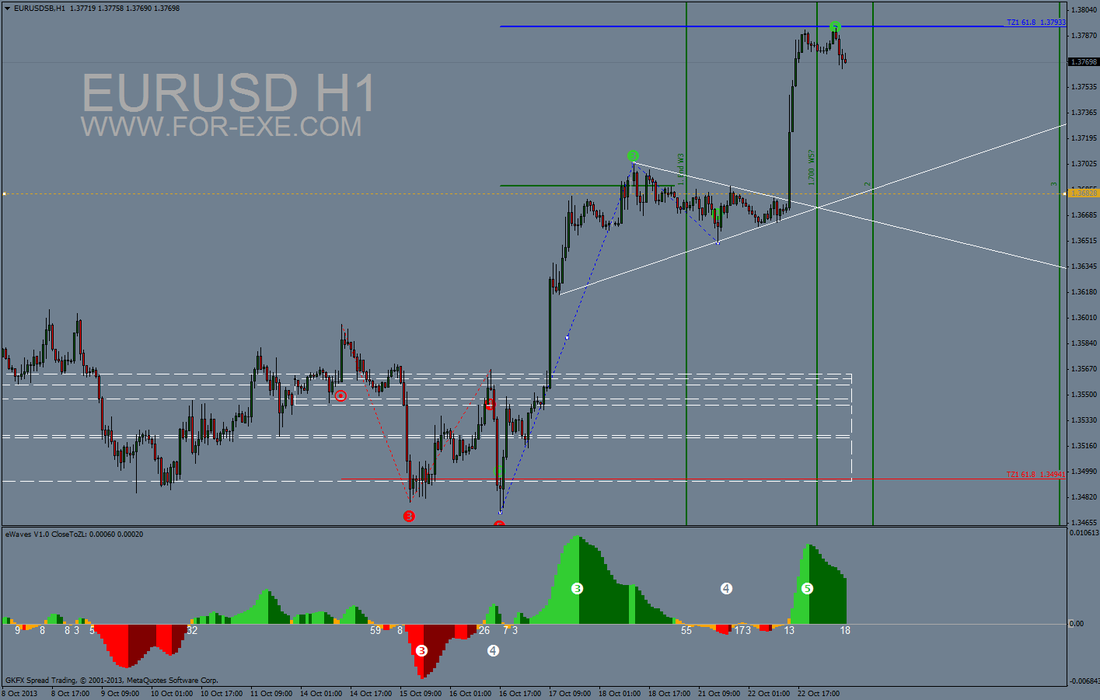
OK so I am a bit biased but nearly two years after I created eWaves, I am still in awe as to how well it works at times. No, I'm not in awe about my coding, more about how Bill Willams discovered the theory on which eWaves is based.
We had an unusual NFP release yesterday - alas I was out and missed it. When I eventually got to my trading PC, the first thing I noticed was TZ1 on EU H1: eWaves had plotted it some 10 hours before the NFP release. A simple trendline break trade would have netted you about 100pips. Almost to-the-pip accuracy for such a major news announcement - and the fib timezone projection was pretty good too - nice one eWaves. The first draft of this indicator is now available for download - here's an example of how it looks ... A multi-level version is in progress... After some blood, sweat and tears, we're finally making some progress with the next version of the Snorm Harmonics indicator. The plan is to find every possible pattern, as far back in history as you chose to go. It will (eventually) also keep checking the current bar for possible patterns and (hopefully) start forecasting where patterns might exist in the future.
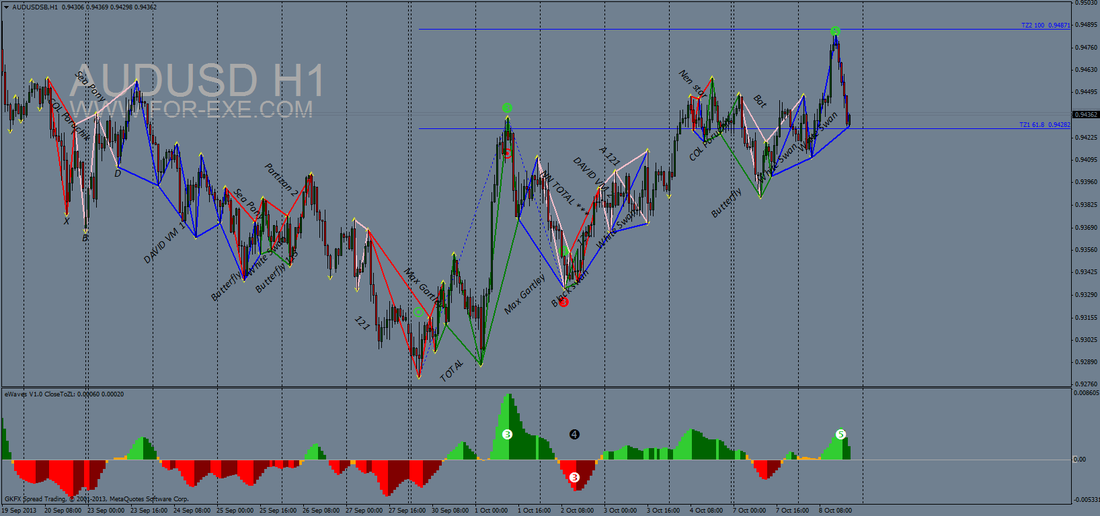
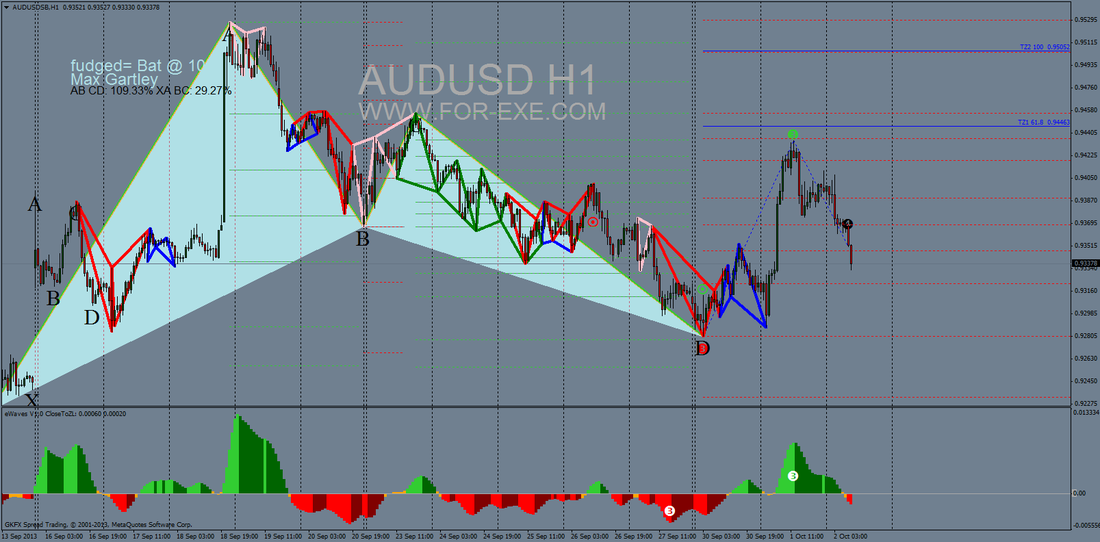
Below is an example of historical patterns on the AUDUSD H1 |
Archives
May 2024
|
|
Website design by Snorm
|

 RSS Feed