 This past week has seen a jaw-dropping $6 trillion wiped off global stocks. We’ve watched record falls across the major indices, with months of gains wiped out in just a few days of trading. The DOW has tumbled some 5,000 points, from its very recent all time high; the DAX fell over 2,000 points from it’s all time high. Just when we thought the bulls would never give up, news comes out to scare the markets and a bear run causes havoc across the globe, threatening to put countries into recession. To those traders who think you don’t need stop losses: I hope you didn’t get too burned. Why have the markets fallen the way they have? You would have been living in a cave If you didn’t know it was because of the coronavirus, or Covid-19 to give it its proper name. But that, by itself, doesn’t explain the panic selling of stocks. The sell-off started with the traders’ view of risk: not so much the risk of deaths from a global pandemic but the risk to company profits, particularly those companies that are reliant on global supply chains and international travel. We are starting to see the risks become issues, with, for example, airlines seeing a drop in demand and suspending flights to mainland China; companies that rely on Chinese-manufactured products, such as Apple, are unable to get stock; big name companies around the world are announcing that they won’t be achieving profit forecasts this and next quarter The trickle of sells quickly became a waterfall, with nervous investors taking a loss on their investments before price falls even further. It will be many months before we know the true impact of the c-virus on company profits and the GDP of countries, yet that impact is already being priced into the markets, long before the truth is known. That’s trading for you: buy the rumour; sell the news. Or, as is the case of last week: sell the risk now, then later buy the news. Another bull run will undoubtedly follow, when the dust has settled, and it’s probably not too early to start looking for bargains, if you’re a long-term investor. Afterall, this is just a correction, when you look at the monthly charts – a rather harsh correction but one that was long-overdue. Could technical analysis have forecasted such a major event on global markets? Well, yes: the writing was on the wall, so to speak. Whether you’re an Elliott Wave expert, a lover of Fibonacci or (as in my case) a fan of eWavesHarmonics (eWH), you would have seen signs of a big sell setting up for the indices. Let’s have a look at the Dow Jones Industrial Average. On the 12th Feb price peaked at an all time high, completing the 5th wave of the 5th wave of the 5 wave – an Elliott Wave analyst's dream. You can see that the eWH add-on indicator, the Wave Finder (top left), also picked up wave 5s from H1 to W1, showing that price was making new highs with divergence. It wasn’t much of a surprise to see a big fall coming from there although, to my shame, I failed to spot the obvious on the day, caught up in the bullish fervour like everyone else. 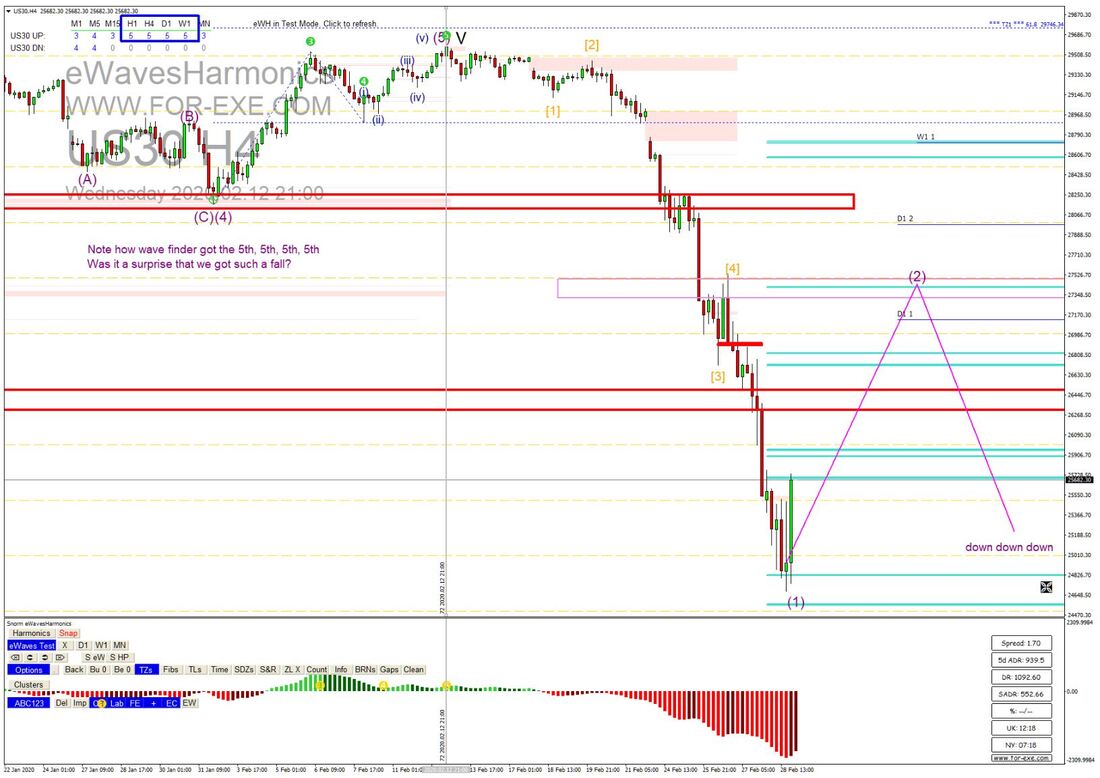 So on the 12th the charts told us that something big was coming. The selling started slowly, then last weekend we had a massive momentum gap down, that really kicked the bears into action. We’ve had some good fun shorting this week but we started looking for the correction yesterday morning – you can see what happened. In theory, the correction should go back as shown in the picture: not as a straight line, obviously, but rather as an ABC correction; but that’s just theory. The markets have really shown us this week: ANYTHING CAN HAPPEN. Unsurprisingly, given their correlation, DAX also had a 5-5-5 and the Wave Finder picked that up as well. Like DOW, price found support on a Fibonacci cluster at the bottom (not shown) before the Friday correction started. 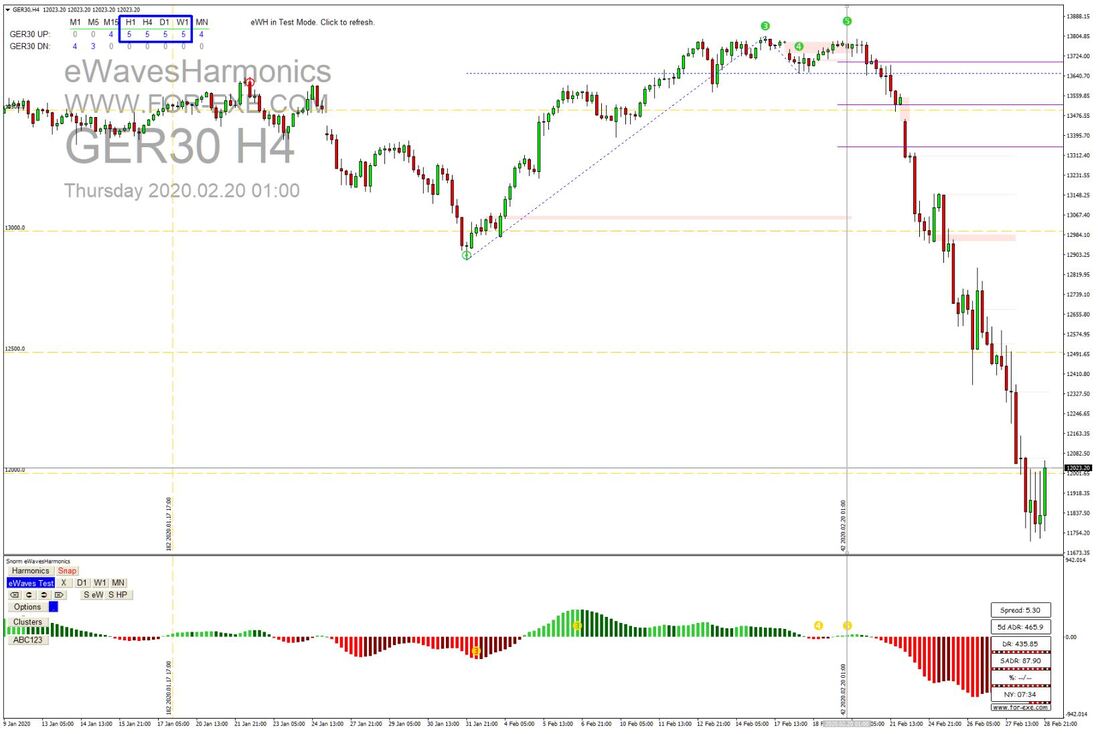 Gold is traditionally the safe haven, where investors look to put their money when the stock market isn’t doing so well. With the indices falling, we would have expected a significant rise this week, but the bulls were going strong long before. Back on the 6th December, I published this trade idea for the daily chart: - 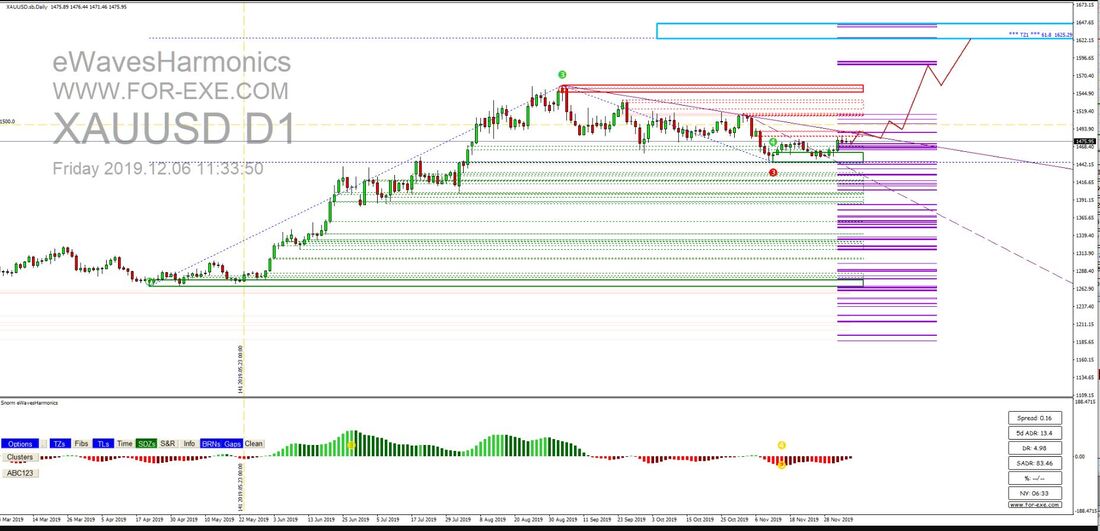 That’s a strong bullish run forecast, using the basic features of eWH and the automatic Fibonacci clusters. As predicted, price broke above the 3S zone, tested it and went above the TZ1 in the week before the indices crashed. It had an exhaustion gap on Monday, with a big upside rejection at the Fib’ clusters, then fell sharply on Friday, as the indices rose to finish the week (a lot of profit-taking before the weekend).. This is how the the PA unfolded on gold ... 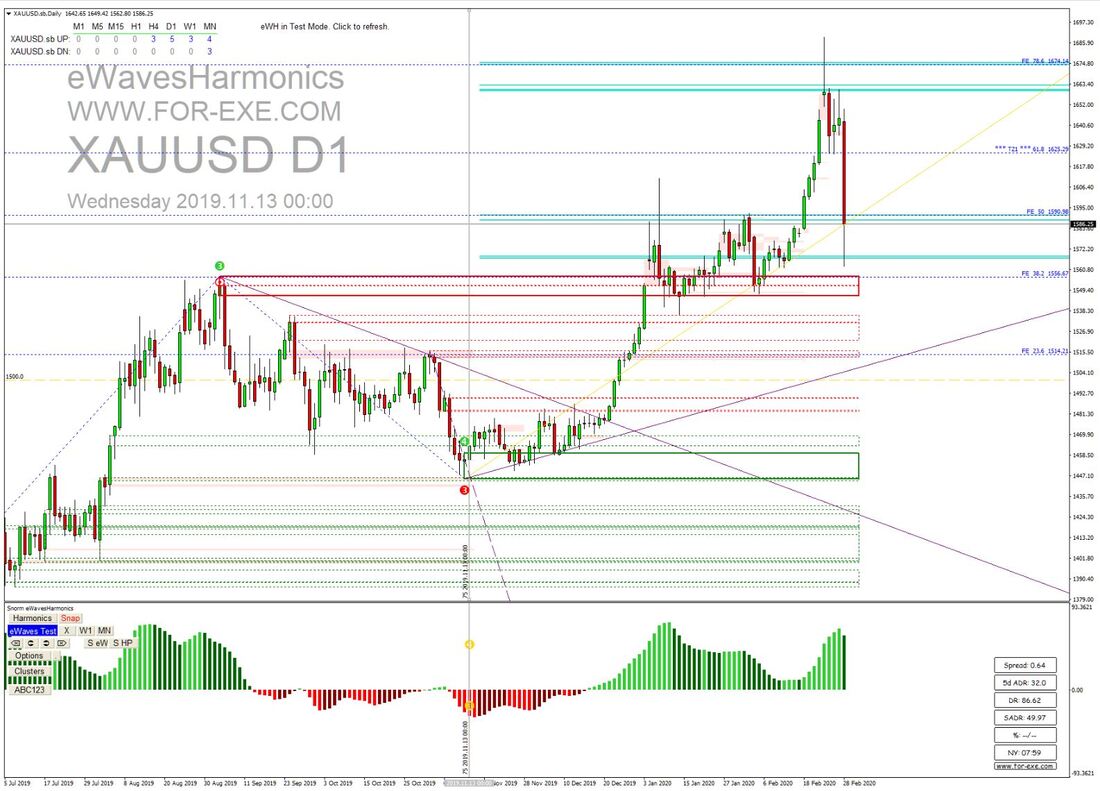 Fundamentals, as with the c-virus and its risk to global economies, are very much the fuel of the market but, as you can see from the few chart examples here, some basic technical analysis can tell you when something big is going to happen, a long time before it does. We saw it clearly with Brexit and GBPUSD and we’ve seen it with plenty of other examples as well. Keep an eye open for those 5-5-5s if you’re looking to get in at the start of a big move.
Whilst there have been some terrific trading opportunities this week, let’s not forget those who have sadly passed away from Covid-19, as well as the loved ones who mourn their loss. It’s an awful time for tens of thousands of people and our thoughts, prayers and best wishes are with them. Take care everyone and be safe.
8 Comments
We saw another mammoth move with DOW on Friday and eWavesHarmonics (eWH), along with some simple Fib' analysis, was very helpful in pointing the way. We attempt to predict where DAX and DOW will go, at the start of the London and New York sessions and, for the most part, the forecasted moves work out pretty well. Friday's DOW prediction was nearly right and is a good topic to do a blog post about - I try to do at least one post a month but have been slack in January ... my bad! This was the prediction posted in our Skype group - a fall, a correction, then another fall.  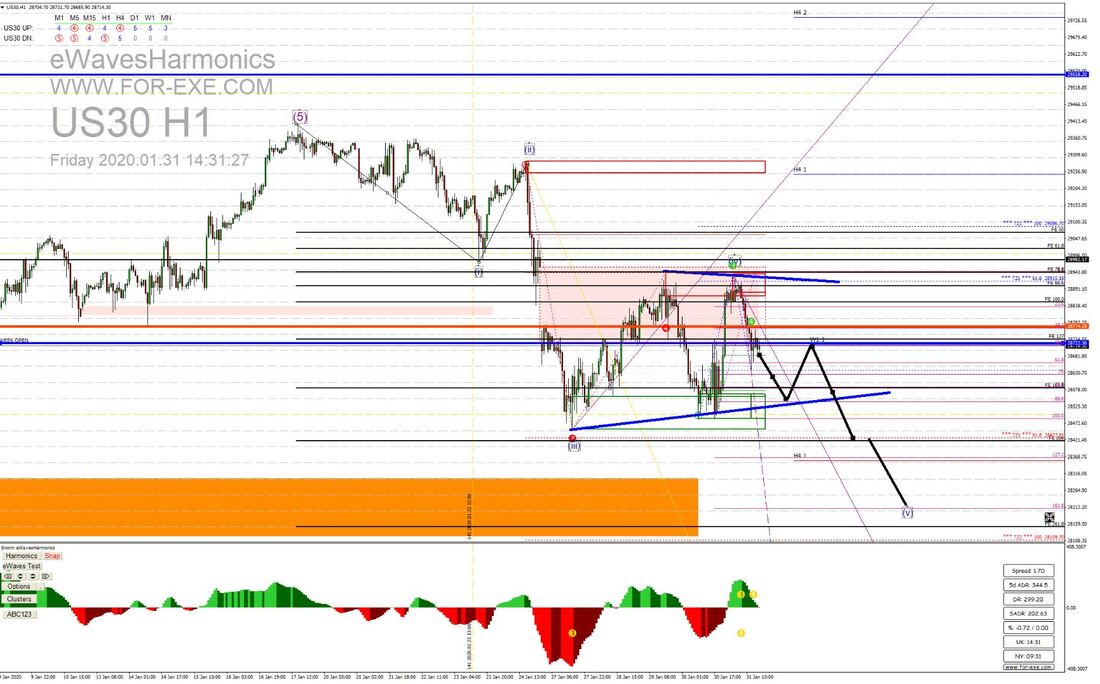 That wasn't really rocket-science. eWH had correctly identified the waves 3 and 4, then plotted target zones 1 and 2 for us .. that was enough by itself. For added confluence, I'd drawn the H1 demand zone, shown as the orange rectangle, then did a Fib' expansion of the waves 1 and 2, plus an extension of the last up wave, within the wave 4.. Given the strength of that move up, it was reasonable to expect a bounce off the 4 demand zone to test the week open, before continuing on down to the target zones. The red TZ2 was below our orange H1 demand zone, so the most probable target was between the 1-2 261.8 Fib' expansion and 161.8 Fib' extension of that last move up; the latter labelled as (V) for our fifth wave. This is what followed ...(with the chart cleaned up a little) 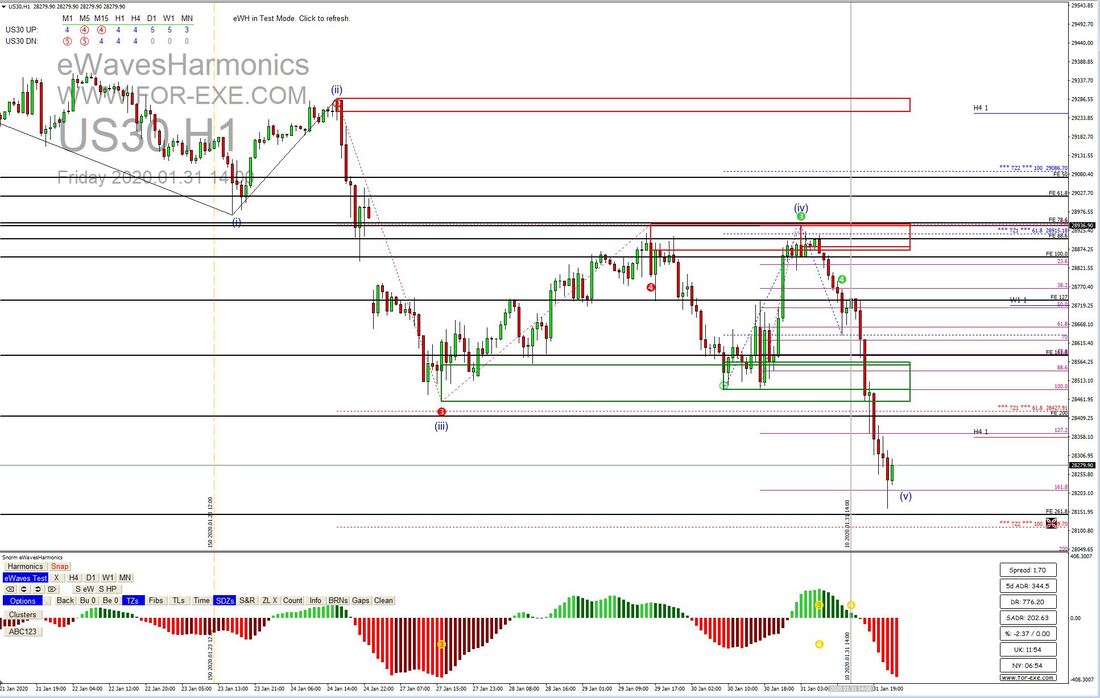 Price fell over 500 points! It didn't correct, as expected, the bears were far too strong; but it hit our wave 5 target just lovely. We trade the one minute charts in the Skype group and do an H1 analysis of DAX and DOW every day, to get some direction for the session, as well as likely targets and, using the clusters tool (shown below) to understand where price might stall and add further confluence to our targets. A regular higher timeframe analysis is an extremely important process, when trading the lower timeframes. To not do it, at the start of a trading session. is like trying to drive a car blindfolded, without a steering wheel and no idea where you're driving to. If you had used the bearish clusters feature in eWH, with the click of a button when the top of the wave 4 had formed, it would have drawn these levels for you (I added the circles to highlight how price reacted) ... 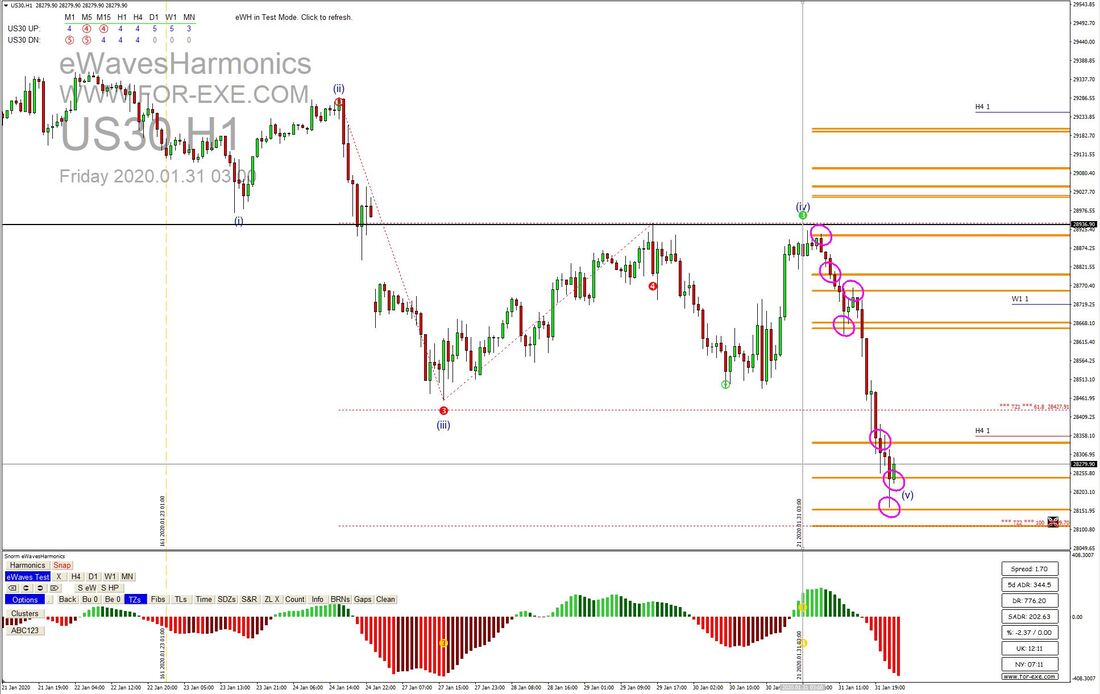 Anyone who already has eWH can put it into 'test mode' and see for themselves how well the clusters worked.
I'm still expecting to see the red TZ2 hit, perhaps on Monday - I don't think the bears have finished with DOW yet. Hopefully, this blog post helps to emphasise the importance and usefulness of a pre-session higher timeframe analysis; particularly for the M1 traders but also for higher timeframe traders. If you have a good idea as to where price is going, it's a lot easier - and more profitable - to look for great setups in the right direction on the lower timeframes. |
Archives
May 2024
|
 RSS Feed
|
Website design by Snorm
|