|
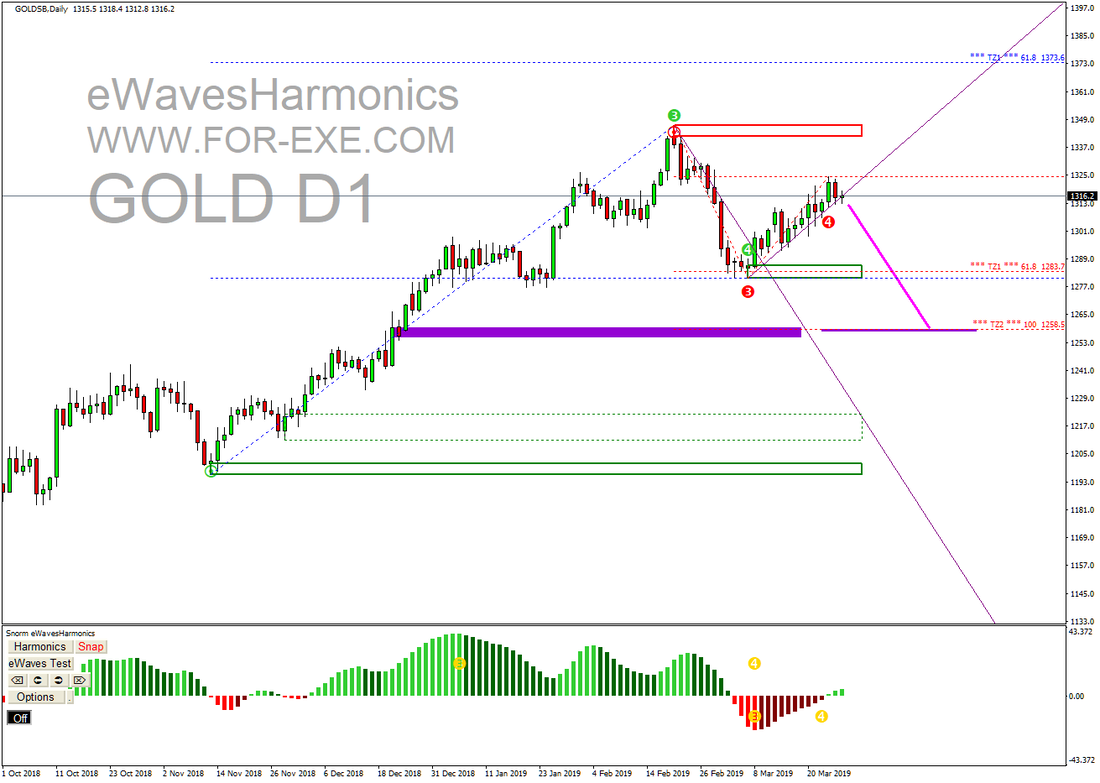
I shared the above chart with some trading friends, a couple of days ago, suggesting it was a good time to short Gold. Within a couple of days, price had dropped to the 4 demand zone and, as you'd expect, bounced. My thought then, as it remains still, is that TZ2 remains a strong target for price; perhaps after it has done some retracing.
There is nothing spectacular in the prediction - it's just reading the price action. Price might just find a base at the 4 zone and fly up to the blue TZ1, proving me wrong and confirming that "anything can happen".. What is spectacular, however, is just how much confluence there is for the top of that red 4 correction and the red TZ2 - much of which I discuss in the video that I've just uploaded to the training course. There were plenty-enough reasons to short around the 1320 level, with a market or limit order, offering a terrific RR down to 1287; and, obviously, an even better RR down to the red TZ2, if you're prepared to ride a correction. Traders who prefer to wait for confirmation, could have traded the close of the TLB bar; there was still a good return to be had. Much of that confluence comes from the Fibo Clusters and there are cluster-clusters down at TZ2. A few of us have been trying out the new cluster-cluster feature this week and the usefulness has exceeded expectations. The latest version of eWH, with the cluster-cluster button, is now available for download, if you want to try it, but I'll probably do a few more tweaks in the coming weeks. That new video, in the training course, shows most of the features used in eWH to: -
0 Comments
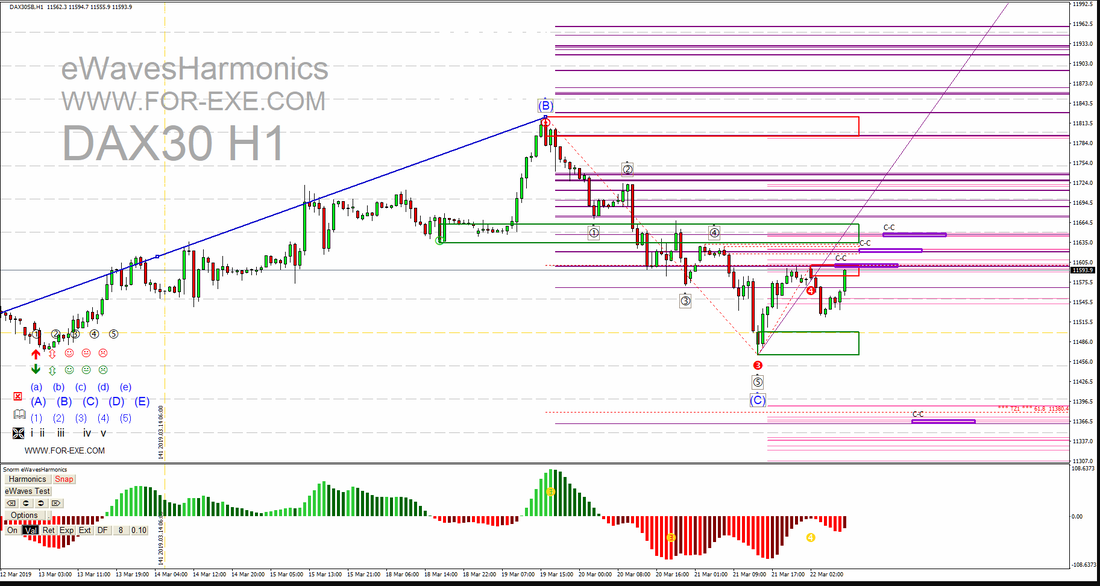
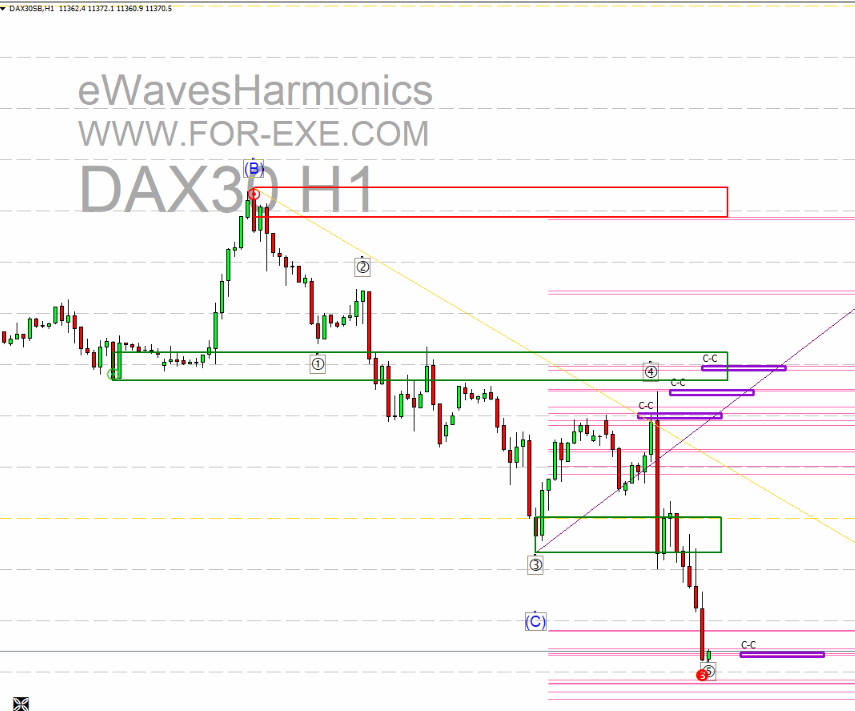
It was a terrific day for the Index Bears yesterday, with some 'there for the taking' shorting opportunities on most of the main indices. Without knowing what the day had in store for us, I posted the above DAX H1 chart before the London Open, showing some 'cluster-cluster' zones that would likely provide resistance above and a price-magnet below. The middle C-C above price was the most interesting, as it aligned nicely with the wave 4 level, as labelled. About half an hour after that chart was published, we were expecting German PMI results; if those results were below expectations, we would likely see one of the clusters acting as resistance, if price got there before hand. The PMI results were much lower than forecast and this is how price moved throughout the day ... from C-C to C-C. 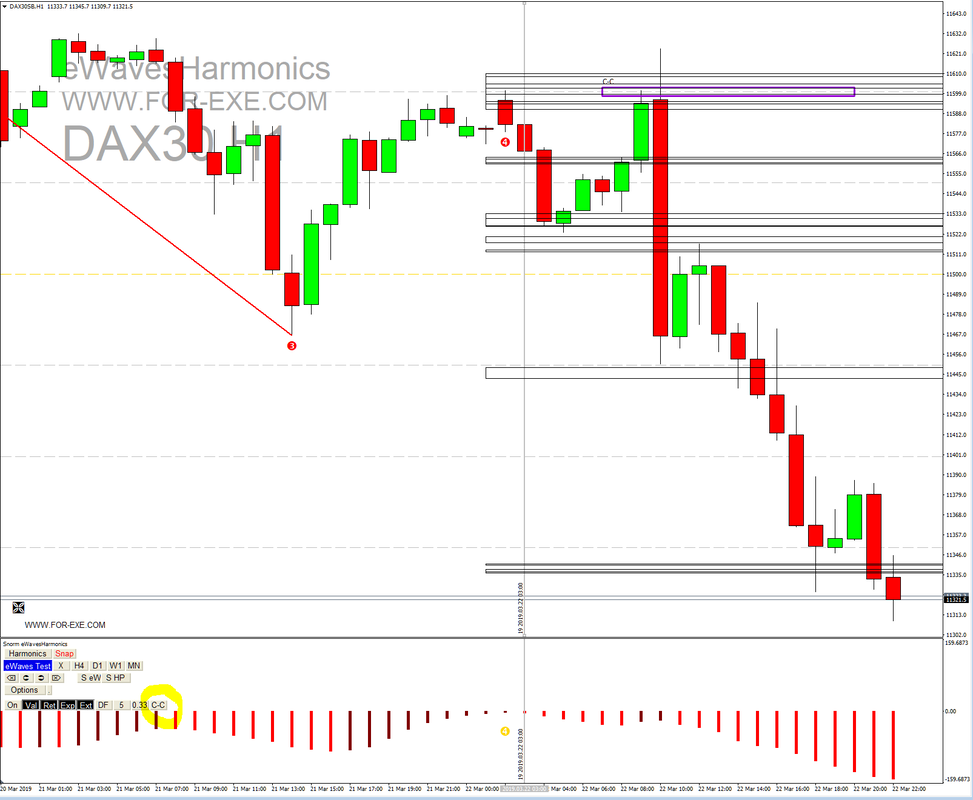 The first two resistance C-Cs held price and the lower magnet C-C pulled price down nicely - and that's pretty much where it settled around the London Close. Over 250 points ...an easily-achievable RR of 20:1.if you had shorted the M1 news bar. Looking for cluster-clusters is a part of my daily routine, so getting some more help from eWavesHarmonics, to reduce the time-spent on mundane tasks, has to be a good idea. Whilst we will never make the human eyeball redundant, an extra button is being added to the Fibo Clusters to scan clusters and draw the C-C zones. This is how the DAX would have looked using the new feature (the first originally-drawn C-C has been left on the chart for comparison) ... It's not too bad, as it stands - these zones were plotted in test-mode at the time of the vertical line, not retro-fitted to price after the event. I'll be doing some more tweaking over the next few days to see if it can be improved and will do another blog post when the update is available for download.
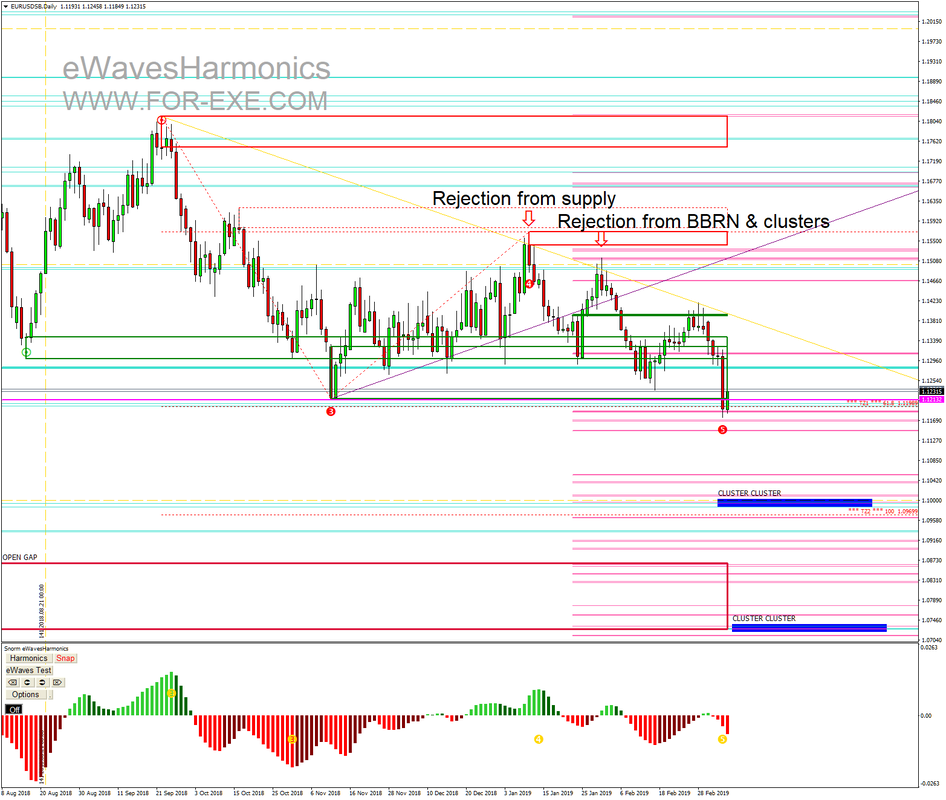
In the meantime, keep an eye open for these cluster-clusters, on whatever instruments and timeframes you prefer to trade; they can be almost magical. If you don't have a clue what cluster-clusters are then you really should take a look at the training course. - it is still free for owners of eWH and ATM. Where next for the indices? Well, we appear to be seeing some strong impulsive bearish moves with more likely to come. DAX daily has recently had a TLB - might 10210 be calling? Very possibly, if the bears remain in control, but there are some C-Cs on the way. EURUSD bounced on the Target Zone 1 yesterday, as plotted by eWH back on the 10th January, when price was rejected by the continuation supply zone, again, plotted by eWH.. That trade, would have netted around 270 pips or more. If you'd missed that, you had a second opportunity to short when price went back to test the BBRN - a good place for a limit sell order, that could have yielded the same return.
Now that TZ1 has been hit, where might price go next? If the bears remain in control, there are two points of interest below the current price, highlighted by using the eWH Fibo Clusters. The first cluster-cluster is pretty close to the Target Zone 2. The second, of particular interest, is right at the bottom of the gap that's been open since April 2017. Might the second anniversary of that gap provide the close? Time will tell ... :) Want to know more about the identification of these trade setups? Check out the Free Trader Training Course, for owners of eWH and ATM. |
Archives
May 2024
|
|
Website design by Snorm
|


 RSS Feed