www.for-exe.com
  • Home
  • eWavesHarmonics
  • INDICATORS
    • MT4 Indicators
    • MT4 Free Indicators & Scripts
    • eWaves v1.0 Manual
    • MT5 Indicators
  • Trade Tools
    • Advanced Trade Manager
    • Advanced News Trader
    • Trade Copier
  • Trader Training
  • Harmonics
    • TheHarmonicIndi
    • TheHarmonicIndi Instructions
    • Harmonic Chart Pictures
    • Harmonic Patterns
  • Trading Blog
  • Contact Us
  • Who is Snorm
  • Q&A
  • Trading Services
  • Useful Links
  • MT4 TIPS and TRICKS
  • Newsletter
  • MetaTrader Wingdings
  • Fibonacci Numbers
  • Privacy Policy
  • Terms of Use and Disclaimer

Predicting the Highs & Lows before a Crash

23/3/2019

0 Comments

 
Picture
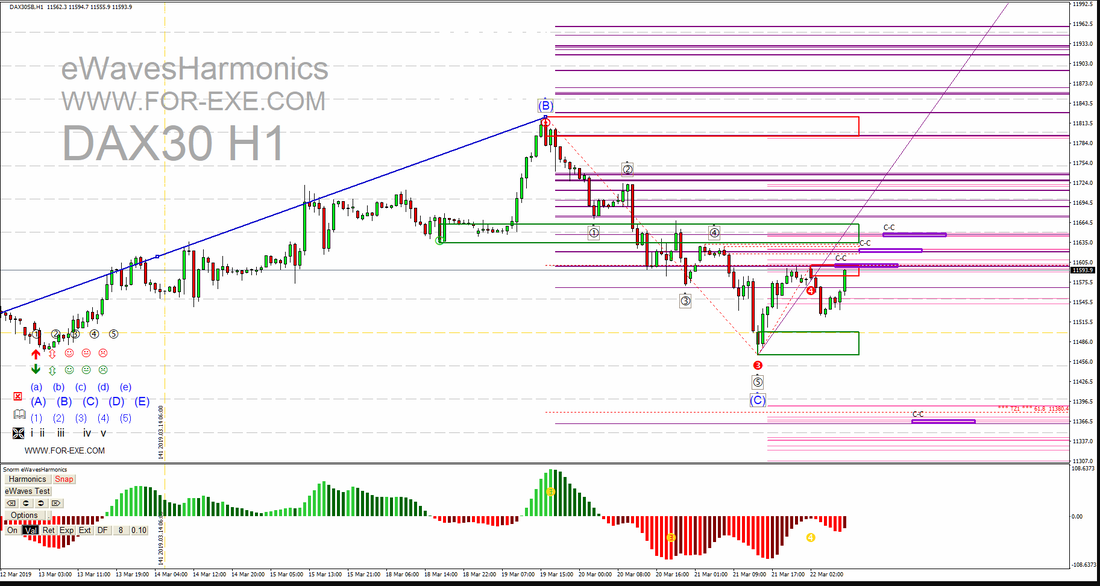
It was a terrific day for the Index Bears yesterday, with some 'there for the taking' shorting opportunities on most of the main indices.   

Without knowing what the day had in store for us, I posted the above DAX H1 chart before the London Open, showing some 'cluster-cluster' zones that would likely provide resistance above and a price-magnet below. The middle C-C above price was the most interesting, as it aligned nicely with the wave 4 level, as labelled. About half an hour after that chart was published, we were expecting German PMI results; if those results were below expectations, we would likely see one of the clusters acting as resistance, if price got there before hand.

The PMI results were much lower than forecast and this is how price moved throughout the day ... from C-C to C-C.
Picture
Picture
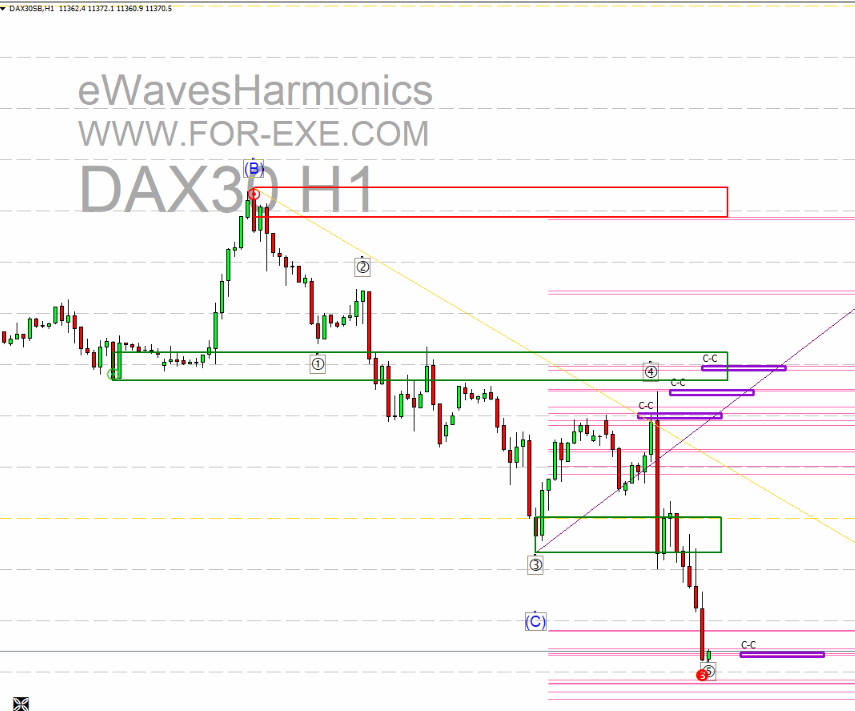
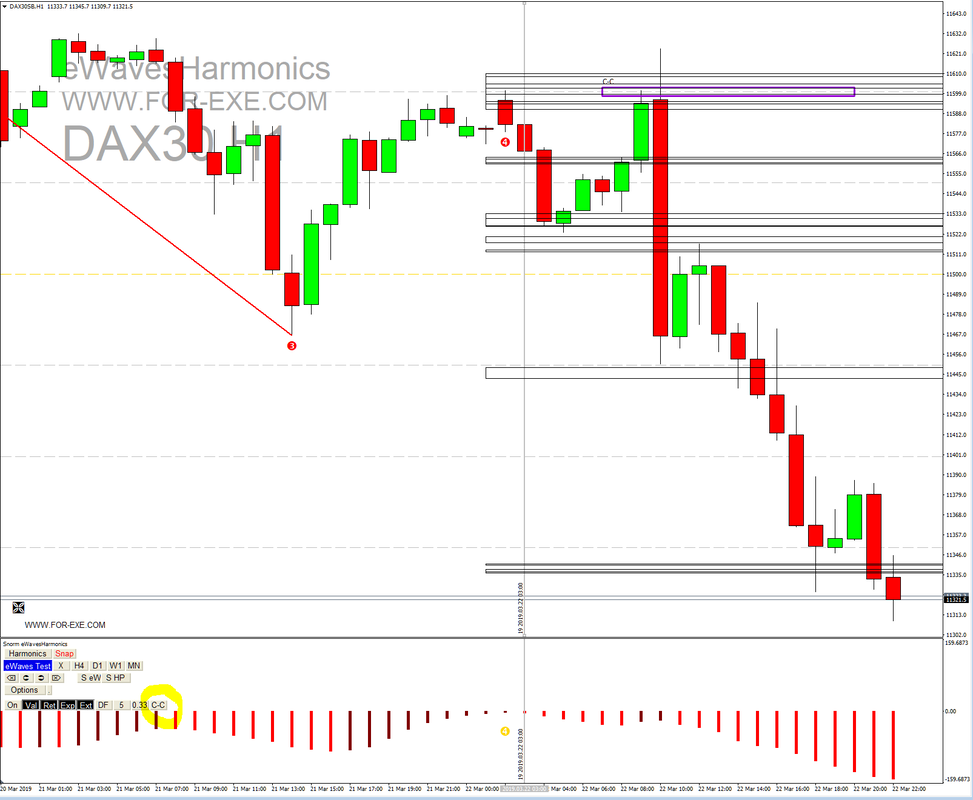
The first two resistance C-Cs held price and the lower magnet C-C pulled price down nicely - and that's pretty much where it settled around the London Close. Over 250 points ...an easily-achievable RR of 20:1.if you had shorted the M1 news bar.

Looking for cluster-clusters is a part of my daily routine, so getting some more help from eWavesHarmonics, to reduce the time-spent on mundane tasks, has to be a good idea.  Whilst we will never make the human eyeball redundant, an extra button is being added to the Fibo Clusters to scan clusters and draw the C-C zones.  This is how the DAX would have looked using the new feature (the first originally-drawn C-C has been left on the chart for comparison) ...
​


​


​

It's not too bad, as it stands -  these zones were plotted in test-mode at the time of the vertical line, not retro-fitted to price after the event.  I'll be doing some more tweaking over the next few days to see if it can be improved and will do another blog post when the update is available for download.

In the meantime, keep an eye open for these cluster-clusters, on whatever instruments and timeframes you prefer to trade; they can be almost magical.

If you don't have a clue what cluster-clusters are then you really should take a look at the training course. - it is still free for owners of eWH and ATM.

Where next for the indices? Well, we appear to be seeing some strong impulsive bearish moves with more likely to come.  DAX daily has recently had a TLB - might 10210 be calling?  Very possibly, if the bears remain in control, but there are some C-Cs on the way.
0 Comments

Your comment will be posted after it is approved.


Leave a Reply.

    Subscribe to Newsletter

    Archives

    March 2023
    February 2023
    January 2023
    December 2022
    October 2022
    September 2022
    August 2022
    July 2022
    June 2022
    May 2022
    March 2022
    February 2022
    January 2022
    December 2021
    November 2021
    October 2021
    August 2021
    July 2021
    May 2021
    March 2021
    February 2021
    January 2021
    December 2020
    November 2020
    September 2020
    August 2020
    July 2020
    June 2020
    May 2020
    April 2020
    March 2020
    February 2020
    December 2019
    November 2019
    October 2019
    September 2019
    August 2019
    July 2019
    June 2019
    April 2019
    March 2019
    February 2019
    January 2019
    December 2018
    November 2018
    October 2018
    September 2018
    August 2018
    July 2018
    June 2018
    May 2018
    April 2018
    March 2018
    February 2018
    January 2018
    December 2017
    November 2017
    October 2017
    September 2017
    July 2017
    June 2017
    May 2017
    April 2017
    March 2017
    January 2017
    December 2016
    November 2016
    October 2016
    September 2016
    August 2016
    July 2016
    June 2016
    May 2016
    April 2016
    March 2016
    February 2016
    January 2016
    December 2015
    November 2015
    October 2015
    August 2015
    May 2015
    April 2015
    March 2015
    February 2015
    January 2015
    December 2014
    November 2014
    October 2014
    August 2014
    July 2014
    June 2014
    May 2014
    April 2014
    February 2014
    January 2014
    December 2013
    November 2013
    October 2013
    September 2013

    RSS Feed

Website design by Snorm
Subscribe to Newsletter
  • Home
  • eWavesHarmonics
  • INDICATORS
    • MT4 Indicators
    • MT4 Free Indicators & Scripts
    • eWaves v1.0 Manual
    • MT5 Indicators
  • Trade Tools
    • Advanced Trade Manager
    • Advanced News Trader
    • Trade Copier
  • Trader Training
  • Harmonics
    • TheHarmonicIndi
    • TheHarmonicIndi Instructions
    • Harmonic Chart Pictures
    • Harmonic Patterns
  • Trading Blog
  • Contact Us
  • Who is Snorm
  • Q&A
  • Trading Services
  • Useful Links
  • MT4 TIPS and TRICKS
  • Newsletter
  • MetaTrader Wingdings
  • Fibonacci Numbers
  • Privacy Policy
  • Terms of Use and Disclaimer