|
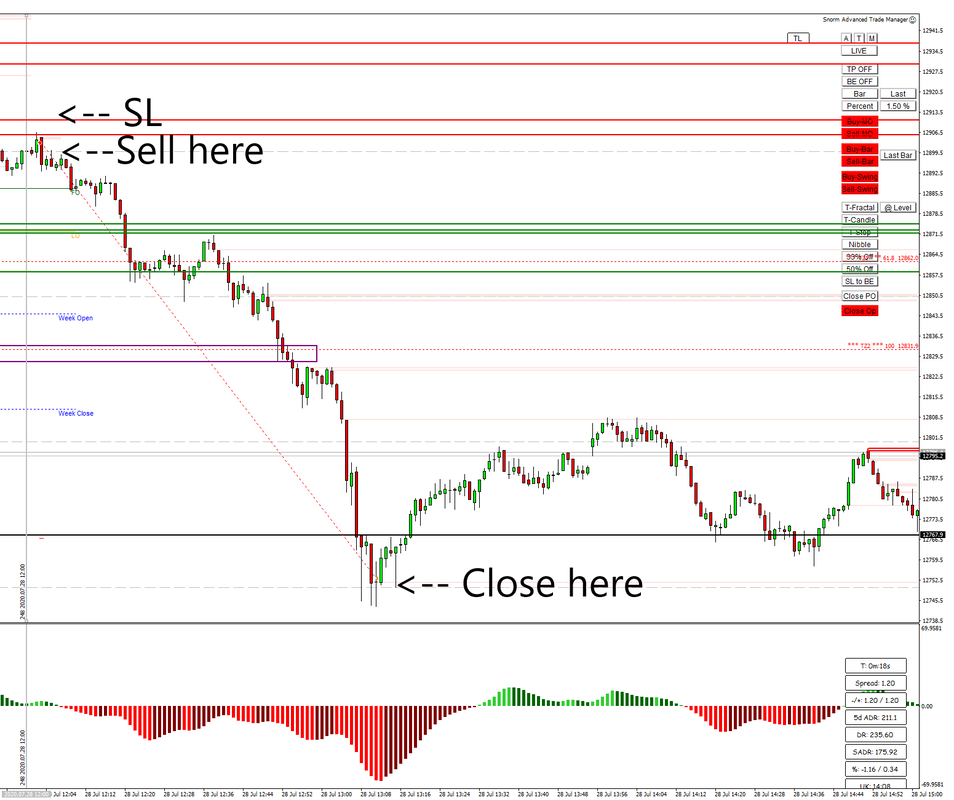
A special mention and big congratulations to Michal, from our Skype Trading Group, who, just yesterday, did his best M1 trade to date - making 21% profit in less than an hour. Incredible stuff!
How did he do it? He simply waited for a very low pip-risk entry (using a strong supply zone drawn by eWavesHarmonics) with an obvious price magnet for his target and some shrewd trade management. Patience - discipline - let the trade run. It's easy when you have the knowledge of price action, tools and discipline - all of which, Michal has mastered and demonstrates time and time again. Trading doesn't have to be complicated to be very profitable; nor do your charts need to be cluttered with useless indicators. Buy the dips, sell the rallies, rinse and repeat.
0 Comments
A trader friend recently asked me whether or not I trade during August – the month where many of the northern hemisphere traders are supposed to be on holiday (less likely during these strange times of Covid-19 lockdowns) and, according to rumour, it’s supposed to be the quietest month for trading. I treat August like any other month, for trading purposes: if the price action is good, on any given day, then I’ll trade it. The question, however, inspired some more statistical analysis, just to see if August really is as bad as many so-called ‘trading experts’ would have you believe. One simple approach is to just look at the monthly charts to see how the August bars compare to the rest of the year. A quick glance at a few charts suggested there was no noticeable difference. Visuals are one thing but nothing beats hard statistics; so I wrote a quick program to export the monthly data (using all available data from my broker – mostly back to 1997) for some of the main instruments, to CSV files. There are two values that seem like logical candidates for this exercise: the monthly price range (high-low) and the tick volume. If you’ve read my blog post ‘Tick Volume a Waste of Bits’, you’ll know that I have little regard for that data, it is however useful for the purposes of comparison. With the data averaged for each month, I was able to make the following summary table (click to enlarge): If we take the first column, for DAX, you can see that May (month five) had the lowest average price range and October (month ten) had the highest. August was 11th (with 12th being the highest). Similarly, using the average tick volume, February was the lowest and October was the highest. Again, August was second from the top. Therefore, it’s plain to see, August is definitely not a quiet month in terms of trading; quite the contrary. The data for the other instruments show that August is also just as good a month as most others, for trading, although the tick volume on GBPUSD and GBPJPY is quite low then.
I would have thought that December would rank lowest for most instruments but, surprisingly, that isn’t so – although we don’t need stats to tell us that trading between Christmas and New Year is a dumb idea. If you find yourself stuck at home this August, trade what the price action gives you. |
Archives
May 2024
|
|
Website design by Snorm
|


 RSS Feed