www.for-exe.com
  • Home
  • eWavesHarmonics
  • INDICATORS
    • MT4 Indicators
    • MT4 Free Indicators & Scripts
    • eWaves v1.0 Manual
    • MT5 Indicators
  • Trade Tools
    • Advanced Trade Manager
    • Advanced News Trader
    • Trade Copier
  • Trader Training
  • Harmonics
    • TheHarmonicIndi
    • TheHarmonicIndi Instructions
    • Harmonic Chart Pictures
    • Harmonic Patterns
  • Trading Blog
  • Contact Us
  • Who is Snorm
  • Q&A
  • Trading Services
  • Useful Links
  • MT4 TIPS and TRICKS
  • Newsletter
  • MetaTrader Wingdings
  • Fibonacci Numbers
  • Privacy Policy
  • Terms of Use and Disclaimer

Simple Price Predictions

1/2/2020

0 Comments

 
We saw another mammoth move with DOW on Friday and eWavesHarmonics (eWH), along with some simple Fib' analysis, was very helpful in pointing the way.

We attempt to predict where DAX and DOW will go, at the start of the London and New York sessions and, for the most part, the forecasted moves work out pretty well. Friday's DOW prediction was nearly right and is a good topic to do a blog post about - I try to do at least one post a month but have been slack in January ... my bad!

This was the prediction posted in our Skype group - a fall, a correction, then another fall.
Picture
Picture
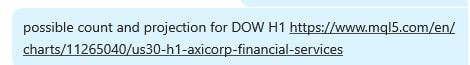
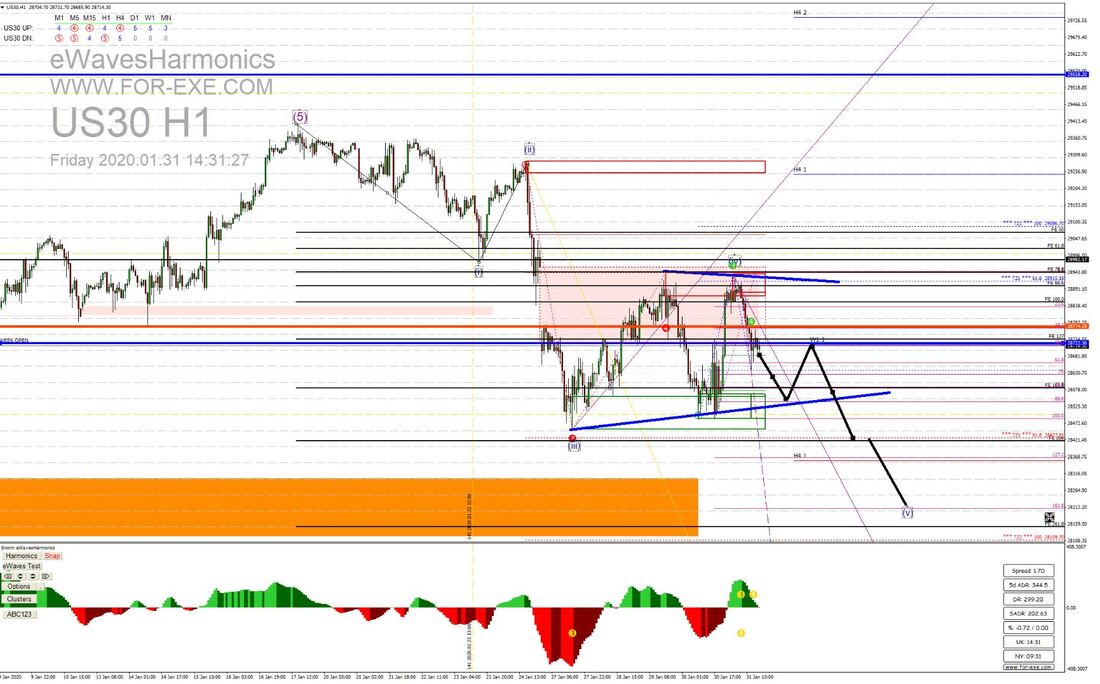
That wasn't really rocket-science. eWH had correctly identified the waves 3 and 4, then plotted target zones 1 and 2 for us .. that was enough by itself.  For added confluence, I'd drawn the H1 demand zone, shown as the orange rectangle, then did a Fib' expansion of the waves 1 and 2, plus an extension of the last up wave, within the wave 4.. Given the strength of that move up, it was reasonable to expect a bounce off the 4 demand zone to test the week open, before continuing on down to the target zones. The red TZ2 was below our orange H1 demand zone, so the most probable target was between the 1-2 261.8 Fib' expansion and 161.8 Fib' extension of that last move up; the latter labelled as (V) for our fifth wave.

This is what followed ...(with the chart cleaned up a little)
Picture
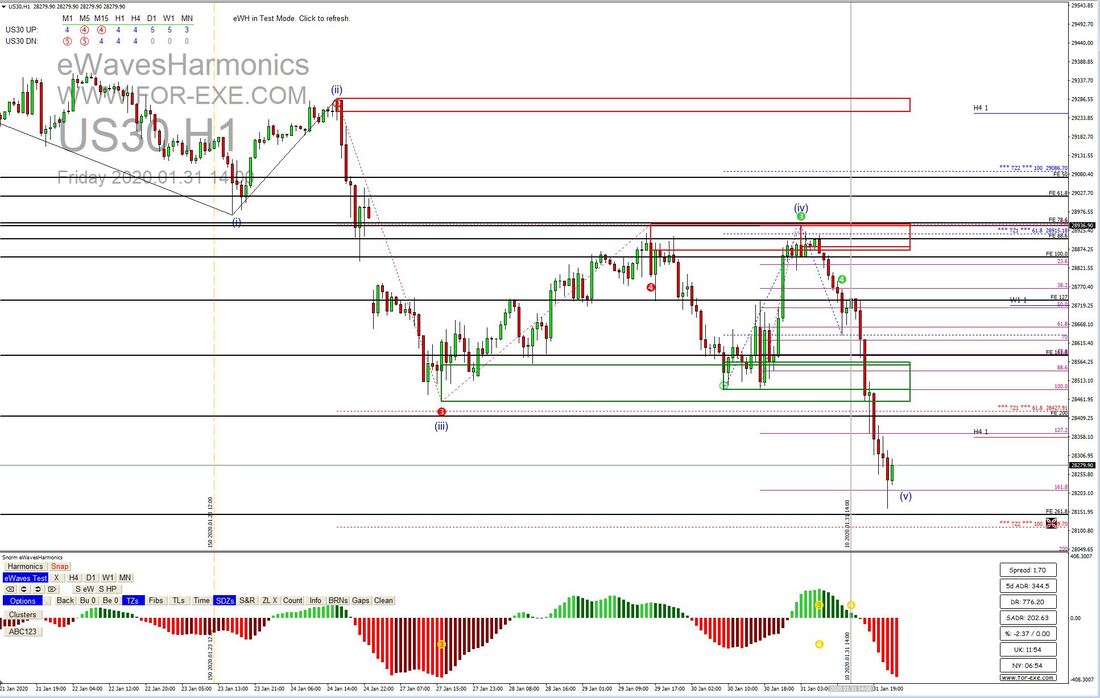
Price fell over 500 points!  It didn't correct, as expected, the bears were far too strong; but it hit our wave 5 target just lovely.

We trade the one minute charts in the Skype group and do an H1 analysis of DAX and DOW every day, to get some direction for the session, as well as likely targets and, using the clusters tool (shown below) to understand where price might stall and add further confluence to our targets. A regular higher timeframe analysis is an extremely important process, when trading the lower timeframes. To not do it, at the start of a trading session. is like trying to drive a car blindfolded, without a steering wheel and no idea where you're driving to.

If you had used the bearish clusters feature in eWH, with the click of a button when the top of the wave 4 had formed, it would have drawn these levels for you (I added the circles to highlight how price reacted) ...
Picture
Anyone who already has eWH can put it into 'test mode' and see for themselves how well the clusters worked.

I'm still expecting to see the red TZ2 hit, perhaps on Monday - I don't think the bears have finished with DOW yet. 

Hopefully, this blog post helps to emphasise the importance and usefulness of a pre-session higher timeframe analysis; particularly for the M1 traders but also for higher timeframe traders. If you have a good idea as to where price is going, it's a lot easier - and more profitable - to look for great setups in the right direction on the lower timeframes.
0 Comments

Your comment will be posted after it is approved.


Leave a Reply.

    Subscribe to Newsletter

    Archives

    March 2023
    February 2023
    January 2023
    December 2022
    October 2022
    September 2022
    August 2022
    July 2022
    June 2022
    May 2022
    March 2022
    February 2022
    January 2022
    December 2021
    November 2021
    October 2021
    August 2021
    July 2021
    May 2021
    March 2021
    February 2021
    January 2021
    December 2020
    November 2020
    September 2020
    August 2020
    July 2020
    June 2020
    May 2020
    April 2020
    March 2020
    February 2020
    December 2019
    November 2019
    October 2019
    September 2019
    August 2019
    July 2019
    June 2019
    April 2019
    March 2019
    February 2019
    January 2019
    December 2018
    November 2018
    October 2018
    September 2018
    August 2018
    July 2018
    June 2018
    May 2018
    April 2018
    March 2018
    February 2018
    January 2018
    December 2017
    November 2017
    October 2017
    September 2017
    July 2017
    June 2017
    May 2017
    April 2017
    March 2017
    January 2017
    December 2016
    November 2016
    October 2016
    September 2016
    August 2016
    July 2016
    June 2016
    May 2016
    April 2016
    March 2016
    February 2016
    January 2016
    December 2015
    November 2015
    October 2015
    August 2015
    May 2015
    April 2015
    March 2015
    February 2015
    January 2015
    December 2014
    November 2014
    October 2014
    August 2014
    July 2014
    June 2014
    May 2014
    April 2014
    February 2014
    January 2014
    December 2013
    November 2013
    October 2013
    September 2013

    RSS Feed

Website design by Snorm
Subscribe to Newsletter
  • Home
  • eWavesHarmonics
  • INDICATORS
    • MT4 Indicators
    • MT4 Free Indicators & Scripts
    • eWaves v1.0 Manual
    • MT5 Indicators
  • Trade Tools
    • Advanced Trade Manager
    • Advanced News Trader
    • Trade Copier
  • Trader Training
  • Harmonics
    • TheHarmonicIndi
    • TheHarmonicIndi Instructions
    • Harmonic Chart Pictures
    • Harmonic Patterns
  • Trading Blog
  • Contact Us
  • Who is Snorm
  • Q&A
  • Trading Services
  • Useful Links
  • MT4 TIPS and TRICKS
  • Newsletter
  • MetaTrader Wingdings
  • Fibonacci Numbers
  • Privacy Policy
  • Terms of Use and Disclaimer