 Due to the low leverage that is available to many traders, since the ESMA regulations were introduced, 5 years ago, some traders have experienced 'Not Enough Money' errors when trying to place trades with ATM, even when only risking 1% on a trade - that's essentially saying there isn't sufficient margin available.
I've made an upgrade to ATM to mitigate this annoyance: ATM will now reduced the lot size, calculated from the percentage risk, by the smallest lot size possible, until it detects that there is sufficient margin. Those who have tested this upgrade have reported back to say all is now good. The upgraded version is available for download from the installation page.
0 Comments
 It’s nearly a whole year since I started what became known as ‘The Project’: writing some auto-traders (robots / bots / EAs) that could be left to their own devices but allowing for some human intervention if required. Whilst I have written countless robots over the past decade or so, this is the first bot project that has consumed so much of my time with near-100% focus, often at the expense of my own trading. The key criterium, for the long-term results, is a simple one: the robot must achieve 10x more percentage profit than drawdown. So, if it achieved 100% profit, the maximal drawdown must not exceed 10%. For the most part, that has been relatively easy to achieve.
The bulk of my time goes into tweaking and constant back testing, across at least three different brokers. All this time spent on development and testing has taught me some valuable lessons, not only about how bad the MT4 back testing can be, but also some for my own trading and how different the brokers’ price feeds can be. I thought some of you might get something from my lessons, hence the post – lessons learned in no order, just as they come to mind. DO NOT TRUST BACK TESTING RESULTS For some obscure reasons, the MetaTrader back testing is heavily biased to showing positive results. I have no idea why MetaQuotes made it so but it’s a total pain in the arse. You can not back test trailing stops within a one-minute bar, for example, as the tick data isn’t there; even if it was there, it would be vastly different between brokers, so you have to make the stops very conservative – far from price -to avoid spikes that the back testing would otherwise not show as stopping your trade. There is also the problem of variable spreads. I’ve seen some wild random spreads (not news driven) on ICM and Pepperstone that back testing won’t pick up: you’d be stopped in live trading or have profits much reduced with the lot size calculation, whereas back testing will say all is hunky dory and the bot grabbed a great trade. The only way to properly test the bot is on a live account, for several months. After each week of live testing, I like to back test that week to compare results, then code some workarounds so back and forward tests eventually align, as much as is possible; it will never be 100%. KEEP IT SIMPLE My previous bot traded five different setups. It achieved >1000% profit for around 20% DD, in less than a year – according to the back testing – but became a monster to tweak and maintain. The other problem was that the base variables for the whole program might not be the best for each setup. After many months in development, I’ve ended up spending many more weeks creating deconstructed bots: one for each setup. This has allowed me to reduce the number of variables in each program and fine tune each setup. Now I have individual bots tuned to achieve the long-term target 10:1 ratio, that collectively achieve a greater return than the all-in-one bot. That's just like normal trading: keep it simple and have specific rules for each setup that you trade. THE PERFECT WAY TO PROVE THE EFFECTIVENESS OF YOUR OWN TRADING SETUPS This has been the most beneficial experience, apart from the buzz of creating profitable bots. It takes so much longer to visually back test setups but once coded into a bot, it takes no time at all to confirm if a setup is really any good for manual trading. I have at least another ten setups to code and test – this will keep me busy until 2025. I’ve always said that any trading idea could be turned into a robot, if it’s any good: the information that a human trader uses is, after all, mostly just a load of binary inputs (on/off; true/false; it is or it isn’t). Has X done Y; is A greater than B, does Q=R; etc. Traders should trade like robots and thus the trading rules could be coded as such. KEEP TRADING THE SETUPS EVEN AFTER A COUPLE OF WEEKS OF DRAWDOWN I’ve seen, from the back testing, that most of my bots go into draw down, for a couple of weeks here and there. When looking at the daily bars, for those draw down periods, I find the average daily range has shrunk to way below normal, or price is stuck in a tight range – it’s no wonder that the bots struggle; I would have struggled to manually trade those periods. It’s pointless expending too much effort into coding workarounds for those periods – time is far better spent on optimising for ‘normal’ periods and just accepting that there will be some weeks of DD. Liquidity will invariably return but we never know when, so it’s just best to keep trading the setups, knowing that the tightly coiled spring will eventually go BOING! From working with countless traders, I’ve seen too many give up when they have periods of draw down; they go in search of better short-term trading ideas and leave behind the most valuable ideas that work in the longer term. Trading (manual or automated) is a long-term game that you cannot judge after just a few weeks. FIBONACCI RETRACEMENTS OF IMPULSIVE MOVES WORK … but they work a lot better when you have plenty of confluence. Of all the bots that I’ve written, trading Fib Rs has been the most successful – achieving 1,114% profit with 15% DD, in less than a year. I suspect there are a lot of Fib R bot traders out there, which helps to make the method more successful. I also suspect they will use different approaches to look for confluence – it doesn’t really matter what you use if it works. I use the information provided by the opening ranges but am looking to add a few other factors for added confluence. To benefit from the rewards of trading Fib Rs, you need to give price plenty of room to do its thing, such as in the last blog post – those occasional big moves will more than make up for extended periods of DD; just like with manual trading. Which are the best retracement levels to trade? Good question … the Fib R bot trades 38, 50, 62 and 78% retraces. Individually when just the one Fib R is traded, the results (from the same period that generated the 1114% profit) are: -
I’ll probably test others eventually but the above 4 are working perfectly well, if not all individually meeting my 10:1 goal. The compounded result, with ever growing lot sizes, is the key to big account growth with relatively low DD. WAIT FOR UPSIDE/DOWNSIDE REJECTION TO SIGNAL THE CHANGE OF DIRECTION FROM KEY LEVELS Japanese candlestick analysts will use individual, or a combination of, different types of bars – all with names that few traders will easily remember. If you’ve done my trading course, you’ll know that I dislike candlestick names and just prefer to see what a price bar has done, or (more importantly) a combination of price bars. When you combine several bars, you can identify upside and downside rejections (or call them pin bar combos if you must) that, when they occur at key levels, can be effectively used to confirm a trade. Success, without these rejection combos, is greatly reduced. NOT ALL BROKERS ARE CREATED EQUAL This has been the most surprising discovery. A bot that trades the exact same setups with the exact same inputs should roughly generate the same results on all brokers – at least that’s what any normal trader would assume. Alas, that’s not the case, since the liquidity providers generate their own prices. I’ve seen a difference of more than 10 points on DOW between brokers and individual M1 bars can vary tremendously. Just to give you an idea, back testing the Fib R bot just for April this year (a particularly successful month, mostly because of the massive move on the 4th)
Why FTMO performs so badly, relative to Pepperstone, has yet to be determined but it’s quite an eye-opener and consistent with all the bots that I’ve tested. However, results can be vastly improved with some FTMO-specific optimisation, to get it much closer to Pepperstone results. I could go on but that’s enough blah blah for this post. I might do a follow up in the future, as more bots are created and tested – the simple ABC zigzag should generate some interesting stats and allow me to prove just how valuable the FE127 is. In the meantime, … back to the project I go.
Every day, in our Skype group, we look to buy the dips and sell the rallies; i.e. we look to identify the end of corrective moves, to get in early on the next impulsive move. It's a simple tried-and-tested approach that makes for the big Rs trades.
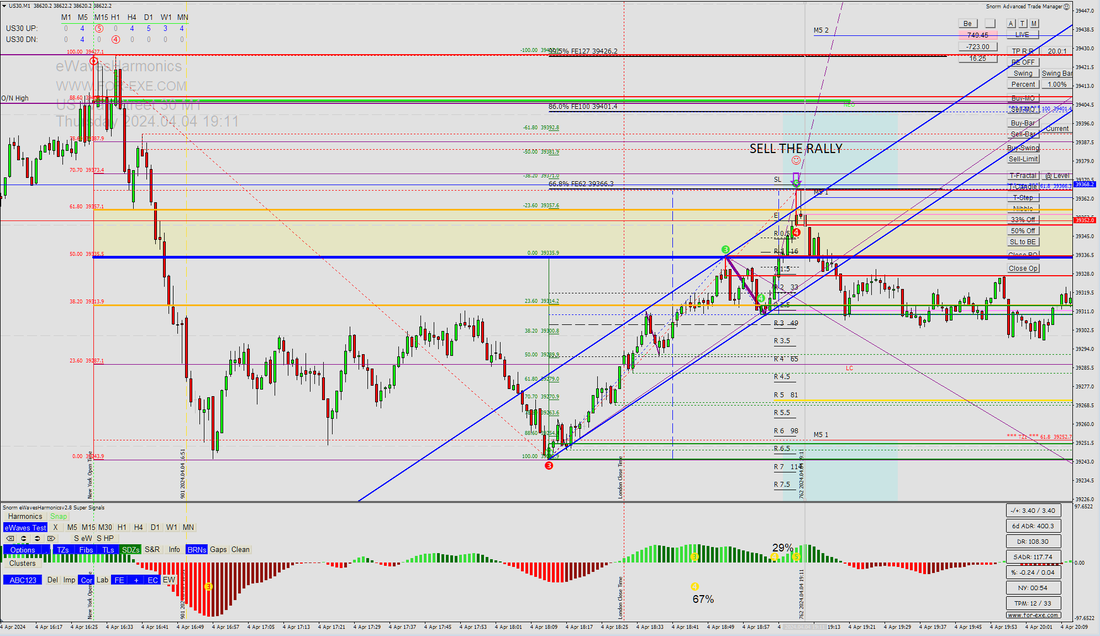
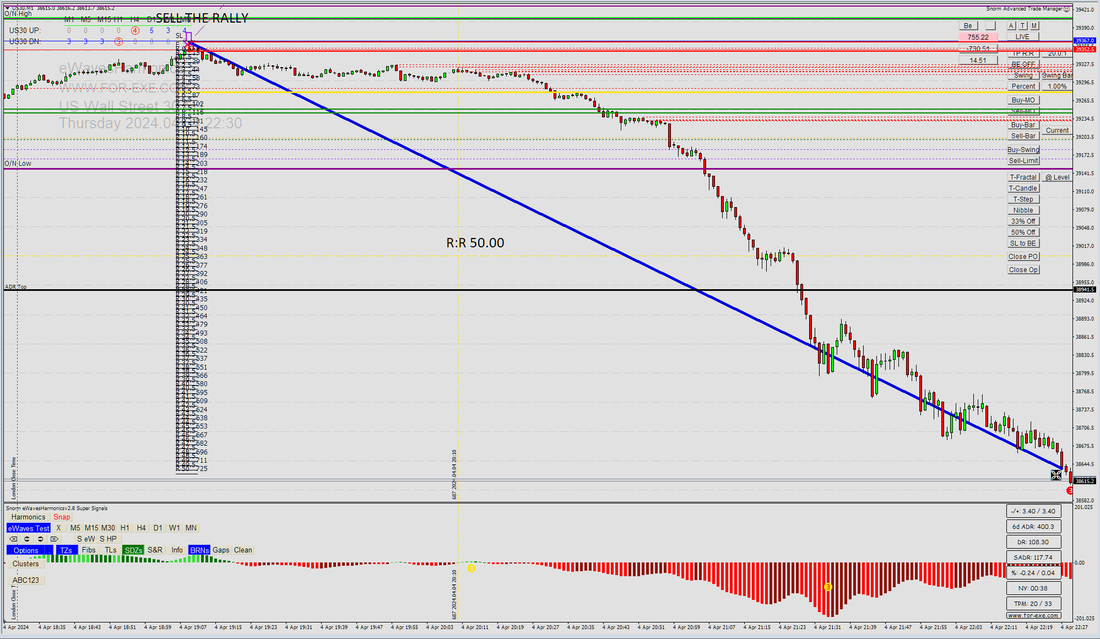
Last night saw the most perfect example on the DOW 1 minute chart. Sadly for me, it happened after my trading day had finished, but what a gem of a trade it would have been - an easy 50R+.. That would double your account in just a few hours, with 2% risk. Using eWH and the ABC123 indies, DOW showed a golden zone correction for a perfect P5 setup, along with a double top and ABC FE62 correction back to prior support: plenty of confluence to place a short trade with a tight stop - a very low point risk trade. The rest speaks for itself.. Trading really doesn't have to be complicated. I just need to finish the work on the EA that trades these setups for when I'm away from the trading desk. 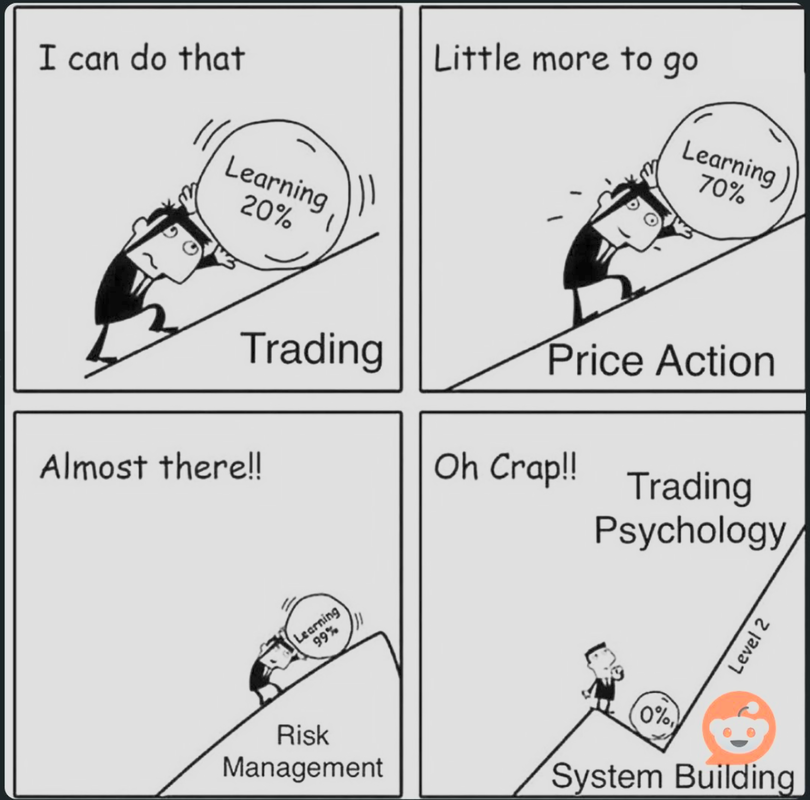 This popped up when I was browsing Reddit - so true!
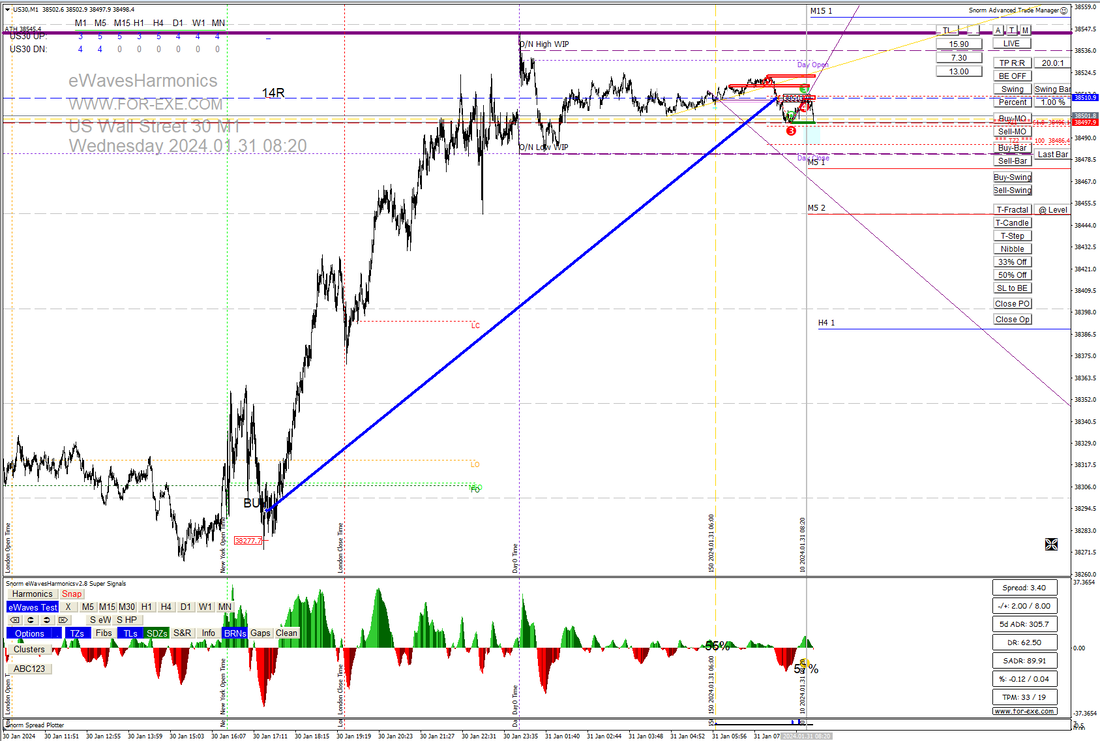 A few of us, in our Skype Trading Group, took this trade yesterday, with various degrees of profit taking. It's a fine example of how a top-down analysis with entries from the M1 time frame, can give terrific R:R.
We have had strong upside targets on the monthly/weekly/daily time frames, that we've been aiming for over the past few months. The "tea leaves" have been spot on and I am still expecting DOW to reach the 40K level, sooner or later. M15 showed a very strong impulsive move up and the day of the trade was a very clear corrective wave. During the NEO session, price had broken the overnight high then retraced for much of the session before the London Close. The ABC123 indi showed FE127 just above a kick-start gap, that had preceded the break of the overnight high - a fine area of demand to be looking to buy; all discussed in the Skype chat so everyone had a chance to prepare. With a strong price magnet of M15 TZ1 to aim for, there was no question that we'd be looking for the next impulsive move up; we just had to wait for the correction to complete and press the ATM 'buy' button. I have uploaded annotated chart pictures to the Training Course - in the section at the bottom with lots of other examples of successful trades done by Skype Group members. It's worth taking a look - you only need a few of these a year to be very happy, but you'll likely see such examples every week, if you know what to look for. Trading made simple with eWavesHarmonics and the ABC123 indi ...  Another year over, and we end the year with the indices at all time highs - who'd have thought that was possible, when the year started and so many global issues ? Well, we did get a clue with eWH, a few months before the end of 2022 - good "tea leaves" (some of you will know what I mean by that).
Once again, many many thanks to you all for your support and success stories throughout 2023 - particularly to my many friends in our Skype Trading Group who have provided such great company. Big CONGRATULATIONS to those of you who have passed prop-firm challenges after doing the course. I hope to be able to work with more of you, this coming year, to help you improve your trading and see more of you achieve your dream of becoming prop-firm funded traders; or any other kind of trader for that matter. All the very best for the festive season and may 2024 be your best trading year yet; and let there be peace on earth for everyone.  If you’re diligent enough to keep a journal, or at least review your trade history on a regular basis, you will know what your ratio of winning to losing trades is. When you know this (rather basic) information, you’ll have a pretty good idea of what sort of R:R trades you should always be aiming for; avoiding trades that don't offer at least your minimum required returns. I recently received an email from a wonderful lady, who is a long-time customer, asking if I could make a change to ATM to place automatic stop losses; effectively making the stop loss wide enough to reduce the number of stop outs / losing trades. ATM can already do stop loss placements using custom indicators, as well as auto-entering a trade, so of course the request could be accommodated. However, such a request begs the question: is it a good idea to go with a wider stop loss, to reduces stop-outs whilst also reducing the potential profitability of a trade? That’s assuming you’re risking a percentage per trade, rather than fixed lots, of course. As I’ve discussed in previous blog posts, I’m a big fan of looking for very low pip/point risk (VLPR) trades, with the goal of achieving at least 5R but seeking 10R or more; this really isn’t hard when taking trades on the lower timeframes. This approach allows for more losing trades but, in my experience, greater profitability. It also makes trading that much more interesting – and challenging – although it might not be everyone’s cup of tea. I’ve done some calculations, to compare profitability based on average win-rate – over 10 trades – compared with average R:R per trade. This table assumes 1% risk per trade on a constant balance of £10,000; in reality that balance would fluctuate after every trade, but I’m trying to keep it simple. (click on the table to enlarge it). 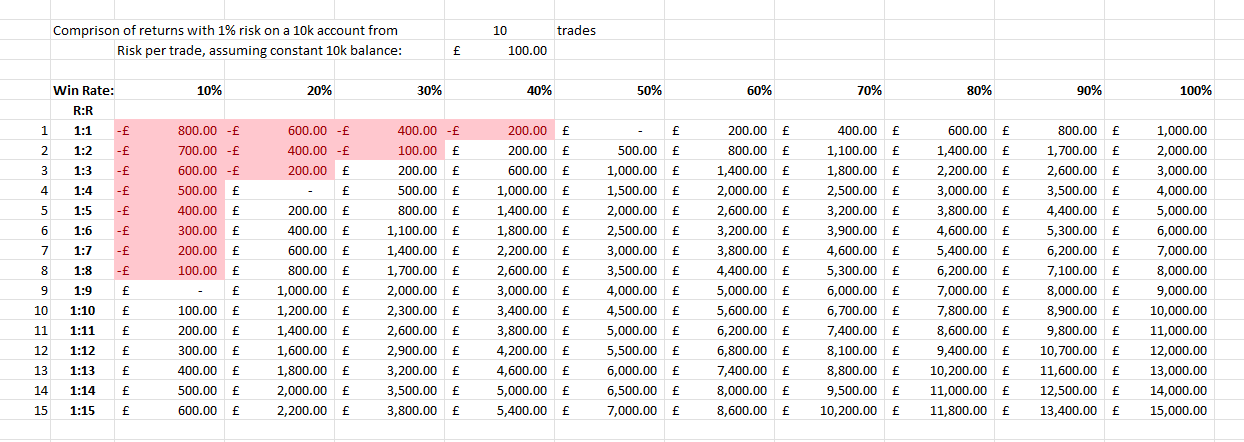 With my average R:R per trade being 5, I need only be right once in every 5 trades to make a profit. If I’m right 40% of the time, I can make a healthy 14% profit with 10 trades.
On the other hand, by widening your stop loss you’ll reduce your R:R. So, let’s say I’m now looking for 2R trades … I would need to be right 50% of the time, just to make 5% profit from 10 trades; or find 80% winners to make 14% profit. Making 8 profitable trades in every 10 is a very big ask – not impossible, but extremely challenging. Personally, I’d much rather feel comfortable about having a losing trade: it’s no big deal when you’re always aiming for a 5% return on a trade. Something to think about but at the end of the day, every trader needs to find their own comfort zone with win/loss ratios and average R:Rs. Just yesterday, I discovered a small 'feature' (aka a bug or glitch) with the Advanced Trade Manager, where it wasn't doing the half / quarter of percentage risk - where that was selected previously - on first use after loading MT. It also wasn't remembering when the Test mode button was pressed, under the same circumstances. They work fine when selected before placing a trade though, which might explain why it's taken so long to discover the glitch.
Both of those have been fixed, for the MT4 and MT5 versions - you can download them from their respective installation pages, if you're an ATM user. Apologies if this has previously caused you any problems but I've received no reports of such, so am hoping all has been good. If there’s anything more that you would like from ATM, please get in touch (email or use the contact form). I’m happy to consider anything that is likely to have a broad appeal. I am still busy, when not trading, with writing and testing robots – the one mentioned in a previous blog post is still in forward-testing – but am happy to add ATM enhancements to the agenda.  Trading psychology is the study of how your emotions, thoughts, and beliefs affect your trading performance and decisions. It's a crucial aspect of trading that many traders overlook or neglect, but it can make or break your success in the markets.
In this post, we'll explore what trading psychology is, why it matters, what are some common psychological biases that traders face, and how to overcome them with practical tips and strategies. What is Trading Psychology? Trading psychology refers to the mental and emotional state of a trader and how it influences their trading behaviour. It involves understanding the impact of emotions, cognitive biases, self-control, discipline, and mental states on trading outcomes. Trading psychology recognises that traders are not purely rational beings but are influenced by a range of psychological factors that can lead to biased thinking, impulsive actions, and suboptimal decision making. Trading psychology emphasises the importance of self-awareness, emotional regulation, risk management, discipline, and resilience to make more objective, consistent, and successful trading decisions. By addressing psychological barriers and developing a balanced mindset, traders can improve their ability to navigate market volatility, manage risk, and achieve long-term profitability. Why Does Trading Psychology Matter? Trading psychology matters because it directly affects the quality of your trading decisions and performance. Here are some reasons why trading psychology is crucial: • Emotions Influence Decision-Making: Trading psychology recognises that emotional biases can influence a trader's judgment and actions. For example, fear can cause traders to close out positions prematurely or to refrain from taking on risk because of concern about large losses. Greed can cause traders to take on excessive risk, chase losing trades, or overstay in winning trades. Regret can cause traders to enter trades after missing out on them or to exit trades too early or too late. These emotions can interfere with a trader's ability to follow their trading plan and execute their trades effectively. • Discipline and Consistency: Successful trading requires discipline and consistency in following trading plans, risk management rules, and performance evaluation methods. Trading psychology helps traders to develop these habits and stick to them regardless of market conditions or outcomes. It also helps traders to avoid distractions, temptations, and impulses that can derail their trading process. • Managing Risk: Trading psychology helps traders to understand and manage the risks involved in trading. It helps traders to assess their risk tolerance, set realistic goals and expectations, and use appropriate risk-reward ratios and position sizing techniques. It also helps traders to cope with losses, drawdowns, and uncertainty without losing confidence or motivation. • Learning and Improving: Trading psychology helps traders to learn from their experiences and improve their skills and knowledge. It helps traders to adopt a growth mindset that embraces challenges, feedback, and mistakes as opportunities for learning. It also helps traders to avoid overconfidence, confirmation bias, hindsight bias, and other cognitive errors that can hinder their learning process. Psychological biases are systematic errors in thinking that affect how we perceive information, process information, and make decisions. They are often unconscious and automatic, but they can have significant impacts on our trading performance. Some common psychological biases that traders face: - • Confirmation Bias: This is the tendency to seek out or interpret information that confirms our existing beliefs or hypotheses while ignoring or discounting information that contradicts them. For example, a trader who is bullish on a stock may only pay attention to positive news or indicators while ignoring negative ones. This can lead to overconfidence, missed signals, or false assumptions. • Illusion of Control Bias: This is the tendency to overestimate our ability to influence or control events or outcomes. For example, a trader who believes that they have a special skill or system that gives them an edge over the market may ignore the role of luck or randomness in trading. This can lead to excessive risk-taking, overtrading, or failure to adapt to changing market conditions. • Loss Aversion Bias: This is the tendency to prefer avoiding losses over acquiring equivalent gains. For example, a trader who is reluctant to close a losing trade because they hope it will turn around may end up losing more than they initially risked. This can lead to poor risk management. Emotional intelligence is the ability to identify and manage your own emotions and the emotions of others. It is generally considered to include three elements: self-awareness, motivation, and self-control. Emotional intelligence can help you improve your trading performance by enabling you to: • Recognise and regulate your emotions: Trading can trigger a range of emotions, such as fear, greed, euphoria, panic, and despondency. These emotions can cloud your judgment and lead to impulsive or irrational decisions. By being aware of your emotional state and how it affects your trading behaviour, you can learn to regulate your emotions and avoid emotional trading. You can also use positive emotions, such as confidence, optimism, and curiosity, to enhance your trading performance. • Understand and empathise with others: Trading involves interacting with other market participants, such as brokers, analysts, mentors, peers, and competitors. By being able to understand their emotions and perspectives, you can improve your communication, collaboration, and negotiation skills. You can also gain insights into the market sentiment and psychology, which can help you anticipate market movements and trends. • Solve problems and make decisions: Trading requires constant problem-solving and decision-making under uncertainty and pressure. By applying emotional intelligence, you can improve your cognitive abilities and analytical skills. You can also avoid cognitive biases, such as confirmation bias, illusion of control bias, loss aversion bias, and overconfidence bias. How to Improve Your Emotional Intelligence for Trading There are many ways to improve your emotional intelligence for trading. Here are some practical tips and strategies: • Practice mindfulness and meditation: Mindfulness is the practice of paying attention to the present moment with openness and curiosity. Meditation is a technique of focusing your attention on a single object, such as your breath, a word, or a sound. Both practices can help you cultivate self-awareness, emotional regulation, and mental clarity. They can also reduce stress, anxiety, and negative emotions that can interfere with your trading performance. • Keep a trading journal: A trading journal is a record of your trading activities, including your entries, exits, profits, losses, strategies, goals, and emotions. By keeping a trading journal, you can track your progress, evaluate your performance, identify your strengths and weaknesses, and learn from your mistakes. You can also use your trading journal to reflect on your emotions and how they affect your trading decisions. • Use positive self-talk: Positive self-talk is the practice of using affirming and encouraging words to yourself. It can help you boost your confidence, motivation, and resilience in trading. For example, instead of saying "I'm a bad trader", you can say "I'm learning from my experience". Instead of saying "I'm afraid of losing money", you can say "I'm prepared to take calculated risks". Positive self-talk can also help you cope with negative emotions and overcome challenges in trading. • Take breaks and relax: Trading can be mentally and emotionally exhausting. Therefore, it's important to take breaks and relax regularly. This can help you recharge your energy, refresh your mind, and restore your emotional balance. You can also use relaxation techniques, such as deep breathing, PS. I used AI to help me write this post - I hope you got something from it. 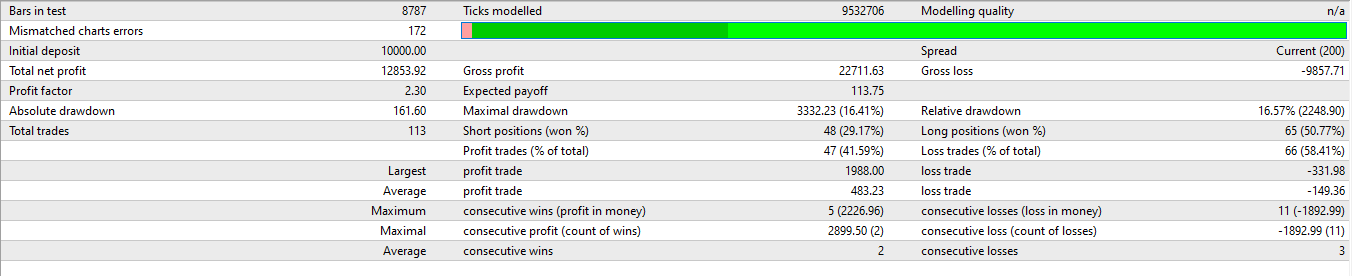 In my book “Predicting and Trading the News” (ref previous blog post), there is a chapter on trading a certain type of gap, that’s often seen around big news events, as well as during normal trading hours – eWavesHarmonics highlights these gaps very nicely (there was a super one on DOW M1, earlier today).
I’ve spent the past month writing an Expert Advisor to trade these specific gaps and back-testing has confirmed just how useful they are. Obviously, like all things to do with technical analysis, nothing works 100% of the time. However, with a good average R:R, you don’t need to have that many winning trades, as can be seen from the above picture. In reality, the win rate from manual trading would be significantly higher but it’s much harder to code a computer to analyse as efficiently as the human brain. The above picture shows the back-testing results for NASD on the M15 chart with a 10k account: 128% return for 2023 to date, with a maximal draw-down of 16.69%. We’re about to start forward-testing now, with a reasonably high degree of confidence that similar results will be seen. Similar returns are being seen on some other instruments, such as DOW, but there are far fewer trades on the main FX pairs, that tend to see less of these gaps. Now you know why I love trading these gaps so much, and why they should play an important role in every trader’s life. It’s too early to say if EA will be made public, when the forward-testing has completed (that needs at least 3 months; ideally a whole year). If you are interested, please subscribe to my mailing list so you don’t miss out. If you want to know what gaps I’m trading, you’ll need to get my book or do the free trading course 😉 |
Archives
May 2024
|
 RSS Feed
|
Website design by Snorm
|