Find the end of one major wave and the start of another with the Wave 5 in Wave 5 in Wave 527/8/2021 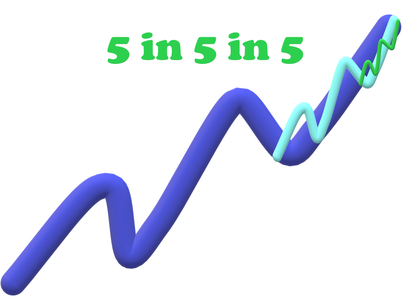 A very nice chap, by the name of Shola, made contact a few weeks back, asking me for some custom options on the Wave Finder indicator, which I duly coded for him. Shola’s focus is on looking for a combination of Wave 5s (and P5s) to identify high probability turning points in significant swings. In a recent email he says: “I like the 555 pattern because of its high risk to reward ratio and it is worth waiting for the setup to develop and then trade it. if the 1st attempt to reverse fails, the second break in structure hardly fails. “ I’m always very happy to hear from someone with a very sound, tried and tested, approach to technical analysis: looking for the 5th wave in the 5th wave in the 5th wave is indeed a good example of such. This is particularly so when looking for the end of a correction on a higher timeframe - the C wave in an ABC zigzag comprises 5 waves, for example. It’s nothing new or ground-breaking: Ralph Nelson Elliott identified the merits of this many decades ago, after studying 75 years of stock market data; a tough task in those days, without the powerful computers that we have readily available today. I’ll never claim that the Wave Finder is the perfect alternative to Elliott Wave analysis by the expert human eye, but there are times when it just happens to be spot on. However, whether it’s true Elliott Wave or not doesn’t really matter, at least for our purposes: we’re using the tool as it is for smart trading and a combination of the eWave 5s, across multiple timeframes. If you’d like to see some examples of the 555 in action, there are some super ones in this short YouTube video, along with a recent example of a 12R:R trade using one feature of the tool. The Wave Finder indicator is an optional add-on, for owners of eWavesHarmonics – a worthy addition to any smart trader’s toolset.
2 Comments
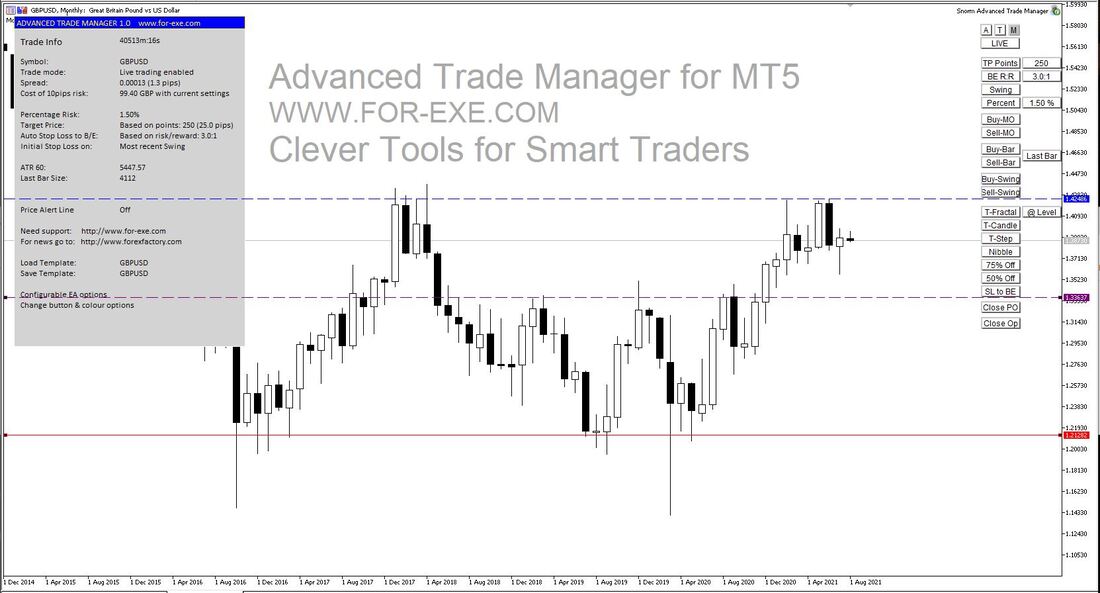 It's taken a lot longer than I planned but the Advanced Trade Manager (ATM) for MT5 is now available.
ATM for MT5 has all the many clever features, of the MT4 version, for speedy trade execution and management, plus the ability to automate your trading and manage trailing stops using your favourite (compatible) indicator. The only thing I have yet to do is convert the free add-on tools that come with the MT4 version - I'll get around to that in due course. As it's an early release, I'm including two extra years on the licence for no extra charge, for the month of August only. See the ATM page to view all the details. Just specify "MT5 version" in the Special Instructions, when placing your order. As for the MT5 version of eWavesHarmonics: that's still very much a work in progress but will be released as soon as possible. 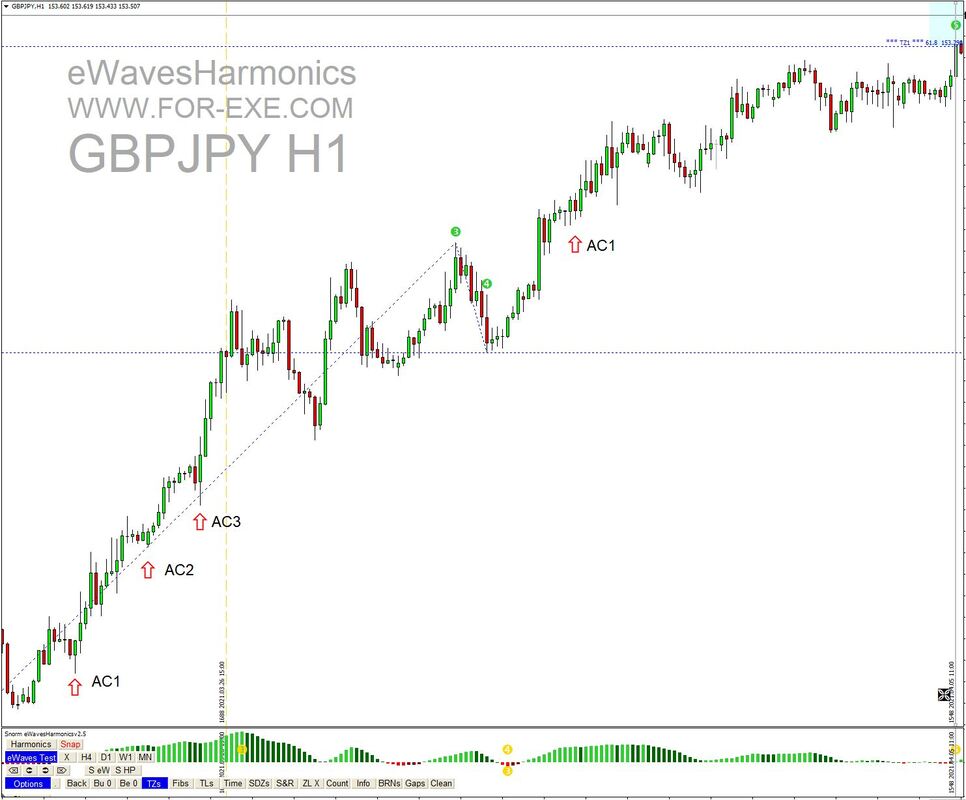 The Wave 4, identified by eWavesHarmonics (eWH) and the original eWaves, has been a long-time favourite way to buy the dips and sell the rallies, looking to get into the next impulsive move for some good R:R trades. You’ll often see that price makes one or more corrections, during an impulsive move or at the very start of it, long before a W4 is formed through a zero line cross (or near to the zero line, as is often the way). By using the eWH histogram and applying some fairly strict rules, we can easily identify such setups and have a point of reference for trade discussions, as we do in the Skype Trading Group. By using these setups, you can often join a Wave 1, 3 or 5 (or even A and C waves), reasonably early - sometimes very early – for some terrific low pip-risk high-reward trades. They also allow you jump in on a wave when you might have missed the early part of it, or to do add-on trades. These useful setups occur frequently (much more frequently than the W4) on every timeframe and every instrument and form a key part of our trading plan – as they should for every trader. As with all setups, we need some rules and we need to know what to look for, particularly as confluence to support our trading decisions. To that end, I’ve created another course video for the free trader training course, that’s just been uploaded and available for viewing. Hope you enjoy this module and find the AC setup as useful as we do for profitable trading. 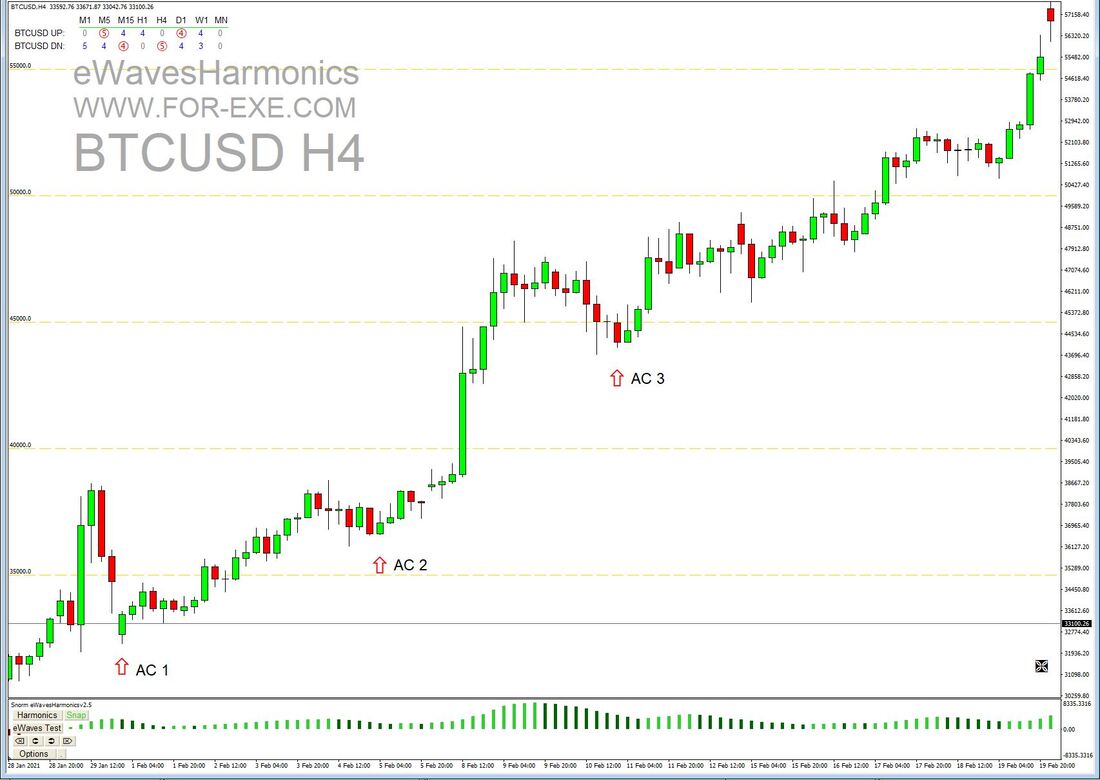 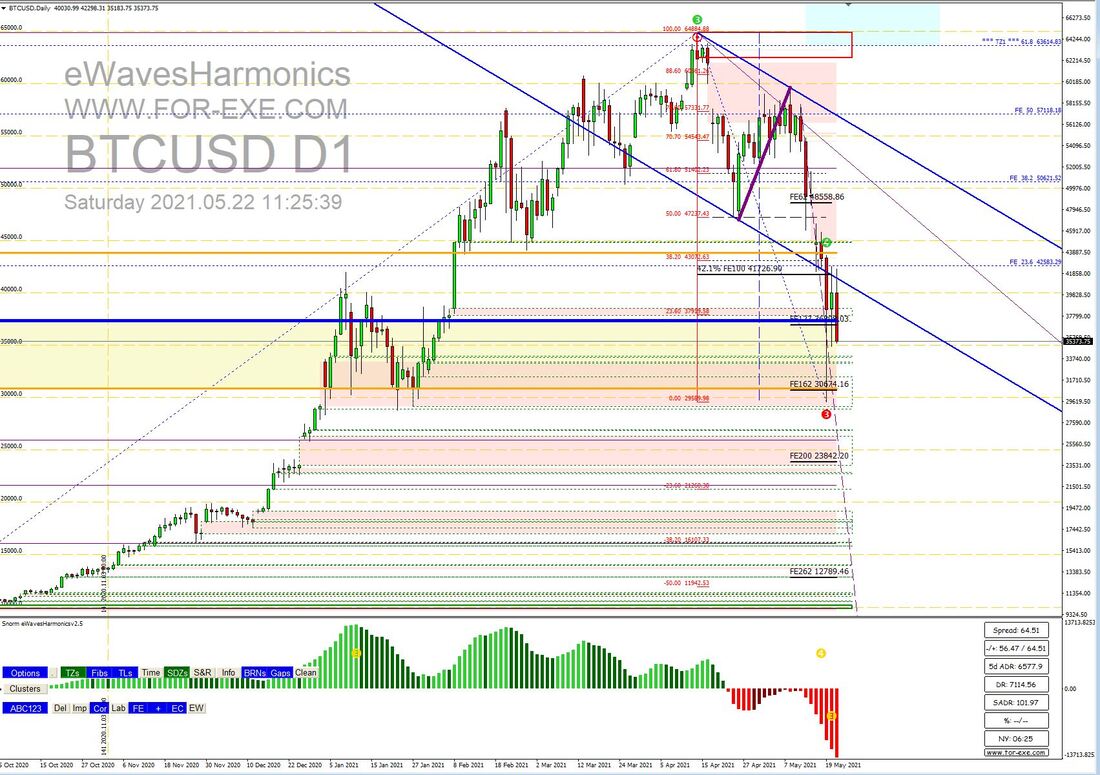 As most of the regular blog readers will know, I mostly trade DAX and DOW on the M1 charts. It’s a nice way to earn a good living and allows me plenty of time to do other things.
With day trading, you obviously need a certain amount of funds to work with, so what do you do with the rest of your funds, if you should have any spare? You could stick it in a bank and earn less than 1% interest per year; you could invest in managed funds where you might expect anything between 5% and 30+% in a year, if they’re any good (I have invested in such funds and they’re working nicely for me – perhaps a subject for another blog post one day). If you prefer to do things your own way, you can buy equities or trade the daily/weekly/monthly charts on pretty much any instrument that takes your fancy: equities, commodities, forex, indices, etc. For much of this year, I’ve been building a portfolio of cryptocurrencies, as I suspect some of you already have. There is no way I would try to trade them on the lower timeframes – the spread / ADR is ridiculously poor, at least on most brokers that offer them for MT4/MT5; and what they do offer for trading is extremely limited, to a few instruments like BTC, ETH and XRP (all of which are still good for long term investments, in my very humble opinion). I treat cryptocurrencies investments like I would if I were still investing in shares: buy and hold; and most importantly, without leverage. By not using leverage, you have almost no risk – unless the coin is binned of course. What you’ve bought will always be yours and there is no chance that the broker is going to do a margin call on your trades and force-close them. The approach I’ve taken is to look for good value, using some of the basic ideas that I talk about in the trading course (I will add a module on crypto, if there is enough demand). Essentially, as I do for day-trading, I buy the dips – at price levels that I consider to be at, or near, the bottom of corrective waves. Unfortunately, I can’t use eWavesHarmonics on the platforms that I use for analysis, but I do use the same logic that is coded into it. The percentage gains, and losses, that you see daily is often mind-boggling and certainly not for the fainthearted. If you’re not prepared to ride the waves, then stay well away. On one day, you can see a coin increase in value by more than 100%; on another day it can drop by more than 50%. We’ve seen Bitcoin, and most of the altcoins, suffer a massive devaluation these past few weeks, on the back of some Elon Musk bla-bla: from $64k to $30K. Bitcoin seems to be in the news more often that Harry and Megan, which is really saying something. Noob traders panic sell, feeding the bearish frenzy. Us long-term traders just ignore the correction – there have been plenty of such corrections in the past, which have just formed a springboard for new highs. Incidentally, it was so obvious that BTC would fall to $30k just from a basic approach to Elliott Wave analysis (as you might gather from the above chart pic). I think 30K is a fine price to pay, if you’re in this for the long-term – and it’s still very good value, if you fancy it (that’s not investment advice, just my opinion). It could still go lower, we can never really know for sure - we're just looking for discounted prices. You might be wondering what I use to make my trading decisions and investments, if you’ve never traded crypto before. Here’s a very quick summary to get you started … For trading I use Binance and Kraken. I find Binance to be more user friendly for everyday use. Kraken: I just have some very long-term holdings and seldom log into it but it’s still a reputable platform. To find cryptos that I’d like to buy, and to keep track of my portfolio, I use CoinMarketCap. It’s completely free, provides good information on the instruments and I can quickly see the gainers and losers in one place – it’s the losers that get my interest, as a buyer of dips. For technical analysis, I use TradingView. CoinMarketCap has links for viewing any instrument on TradingView, making it the obvious first place to go. I am working on a version of eWaves for TradingView, that (if all goes well) will become a version of eWavesHarmonics in due course. For BTC, ETH and XRP, I just use MT4 and eWavesHarmonics, so that’s nice and easy. There are plenty of good reasons to invest in cryptocurrencies, not least of all their ever-growing market cap and liquidity. I believe they are here for a very long time to come and provide terrific long-term growth potential, that you’re unlikely to see with many other instruments. If you’re looking for some good long-term investments, now might be a good time to go crypto-shopping, given the recent dips in prices across the vast majority of them. Start small, risking money you could burn and be prepared to ride the very big waves.  Just a quick post to let you know that the conversion work, from MT4 to MT5, for Advanced Trade Manager and eWavesHarmonics is going well. Lots of testing required and the inevitable bug fixing but we hope to have release-versions available this month.
Subscribe to the mailing list if you would like to get an early copy - an email will be sent when the first of the two products (probably ATM) is available.  *Warning* This blog post has frequent use of a four letter word in it – sensitive readers might prefer to read a romantic love story instead.
My wife bought me a fantastic book for my birthday, that I highly recommend: The Subtle Art of Not Giving a F*ck by Mark Manson. In a nutshell, it talks about caring less about things that you can’t control and to stop trying to be “positive” all the time. I realised a long time ago, through my own life experiences, that you’re more likely to lose that which you intensely cling on to. In your desperation to not lose something of which you hold great value: your job, for example … you might subconsciously do things to justify your worries about losing it; get the sack and say to yourself: “see, I was right to be worried”. Perhaps you once lost a girlfriend/boyfriend that you loved dearly because you just tried too hard to keep her/him, instead of just enjoying the great relationship. The list of things that you might give too much of a fuck about is endless. How many of those things would bring about the end of your life, or even worse, the end life on earth if you were to lose them? The chances are that you give a fuck about things over which you have absolutely no control, with endless sleepless nights while you gnash your teeth with worry. You need to decide what is important in life and what you can control; likewise, you need to identify what you can’t control and to stop giving a fuck about it. “The desire for a more positive experience is itself a negative experience” And, paradoxically, the acceptance of one’s negative experience is itself a positive experience”. You know where I’m going with this, right? We all want to be successful traders, for which we must have winning trades. I’ve written blog posts in the past that talk about this subject but I still speak with traders today who have read my blog posts and still give too much of a fuck about elements of their trading that they can’t control. What’s the obvious thing about trading that you have no control over? It’s price – short and simple (unless you’re a trillionaire with enough funds to move price). You so desperately want your trade to be a winner, to prove to yourself (and perhaps others) that you’re a great trader – price doesn’t care. You might spend much of the day doing positive affirmations and doing visualisation exercises, but price won’t give a fuck about that either. When your trade ends up as a loss, you find yourself obligated to commit hara-kari or drink a crate of whisky to drown your sorrows, rather than to learn from the loss and move on. We can control when we enter a trade – we pick the time, the entry price, the stop loss and the target price (target price should always be your first decision, by the way – not a random entry because some squiggly line indicator flashes a signal on your screen, as most trading noobs look for and most scammers sell you). So, we give a fuck about our trading choices – if we didn’t, we’d blow our trading accounts in double quick time. We can’t control what price does once we’ve entered a trade – we have to not give a fuck about the outcome of the trade because price doesn’t care. If you give a fuck about what price does, you will do stupid trade management actions in an attempt to prevent a loss because you give too much of a fuck about losses and too much of a fuck about wins. There are plenty of examples of ‘give a fuck stupid trade management actions’ but the main ones are: -
 Many traders love to throw around meaningless terms that they’ve picked up from useless forum threads / scammers / mega-bucks courses / etc. and think they’re clever; but are they really? I feel it’s time to get some things off my chest about how irritating the commonly used terms can be …
Let’s start with the word ‘trend’. It is extremely subjective – where one person sees the trend as being up (because they’re looking at, say, 100 bars), another might see it as being down (because they’re looking at 300 bars). Unless you’re going to be specific about the timeframe, the word ‘trend’ is meaningless, so don’t use it. As I type, the trend on Gold on the D1 timeframe, since 7th August 2020 is down (it’s actually in a corrective swing). The trend on Gold on the D1 timeframe since 15th August 2018 is very much up. The trend on Gold H1 since the start of 2021 is very much down. You get my point? You must give a reference timeframe when you use the word ‘trend’ or ‘trending’. Overbought and oversold – I never ever use those terms. What do they really mean? Something has been bought or sold too much? Who is sufficiently qualified to define what is ‘too much’. Many will refer to (what I consider to be) completely useless indicators like RSI (which is just price in another form) for the definition; but how many times does price just continue rallying up in the ‘overbought’ zone. Sure, you might get a correction when wave 3 and 5 have reached their targets but it doesn’t mean price is overbought or oversold. Rather think about when a correction might be coming in a move that clearly has upside or downside momentum, then look to buy the dips/sell the rallies. Plain old common sense and reading of price action will give you a clue that a correction should come at some point. No doubt the OB OS RSI fans will have plenty of examples of where price corrected from the OB OS levels but then look at DOW D1 during Jan 2018 where price was supposedly overbought for the whole month and climbed about 2000 points – would you have stayed away from taking longs during that time??? Noise!!!! “The lower timeframes are just noise” Aaaargh!!!! That really annoys me. There is no such thing as noise when it comes to price action. The lowest timeframes give the best RR trading opportunities when trading the higher timeframes, so don’t ignore them because some so-called-guru says they’re just noise It’s offensive to price action and completely ignorant. The lower timeframes create the ‘butterfly effect’, so pay attention to them, regardless of the timeframe that you are trading. While I’m having a rant, let’s talk about candlestick names that some well-known traders (at least they would have you believe they are traders) have made a lot of money writing books about and selling courses. There’s a module in my course about this and guess how many candlestick types I have: 3 ! You don’t need to remember obscure Japanese words and ridiculous names like ‘Pin Bar’ (named after a fictional wooden puppet) – just see what the price bar is telling you in relation to previous bars and key levels (ref the last blog post). Save yourself a lot of wasted effort and money in learning what you do not need to learn to trade. That’s it – rant over. Feel free to rant back if you disagree 😊  For the purposes of this exercise, put to the back of your mind everything that you have read about trading and technical analysis. Your best approach to technical analysis will be what you discover for yourself: it will be more meaningful to you, more enduring and easier to trade. If what you discover rings bells with what you’ve previously learned, then great! That reinforces things and makes them real to you.
Find some time that you can focus undisturbed, without phone calls or text messages, etc. This is allocated as “time that you own” and really is your own time in every sense. Load a random chart (any timeframe will do) from your preferred instruments. Remove all indicators, any grids or lines, so you only see time and price candlesticks (about 150 bars to the chart screen should do it). Now go to the start of your chart history, and begin the process by scrolling through, one bar at a time, from history to today and allowing a reasonable amount of time for each bar
This exercise is obviously all about reading price action – really reading it. When you become competent at it and can start predicting where price will go to, using no indicators and just price bars and previous levels, along with some Fib’ tools, you’re becoming a good technical analyst and well on the road to becoming a professional trader. The hard part though, after mastering the reading of price action, is to master yourself – but that’s another story. Most of you will have already done something like the above exercise; perhaps whilst testing every indicator and combination of indicators that you can fit on to your chart. It will be so much more rewarding when you can analyse naked charts and make your own predictions from what the history of price has told you. You do not need any indicators to be able to trade. eWavesHarmonics just removes a lot of the manual process that you should be doing yourself and helps to remind you of what is important, where the key levels are and where price might go to. Nothing will ever beat what the human brain can interpret from reading price action; especially the brain of a seasoned trader who has studied decades of price action, from back-testing as per the above exercise and live trading. The Trader Training Course teaches how to read price action if you need some help along the way but see what you can find for yourself.  That was an interesting year! I'll not mention the 'C' word but I will say that despite the horrible stressful times, that too many of us suffered, the markets gave us something to be very happy about
I wish you all a very merry festive season, as much as the lock-downs in many countries allow. Thank you most sincerely for all your support, kind words and success stories (please keep those coming) this past year. I've no doubt that 2021 will be ever more successful for us traders; and hopefully the 'C' word will soon be behind us. Stay safe, keep well and may Santa bring all that you desire :) 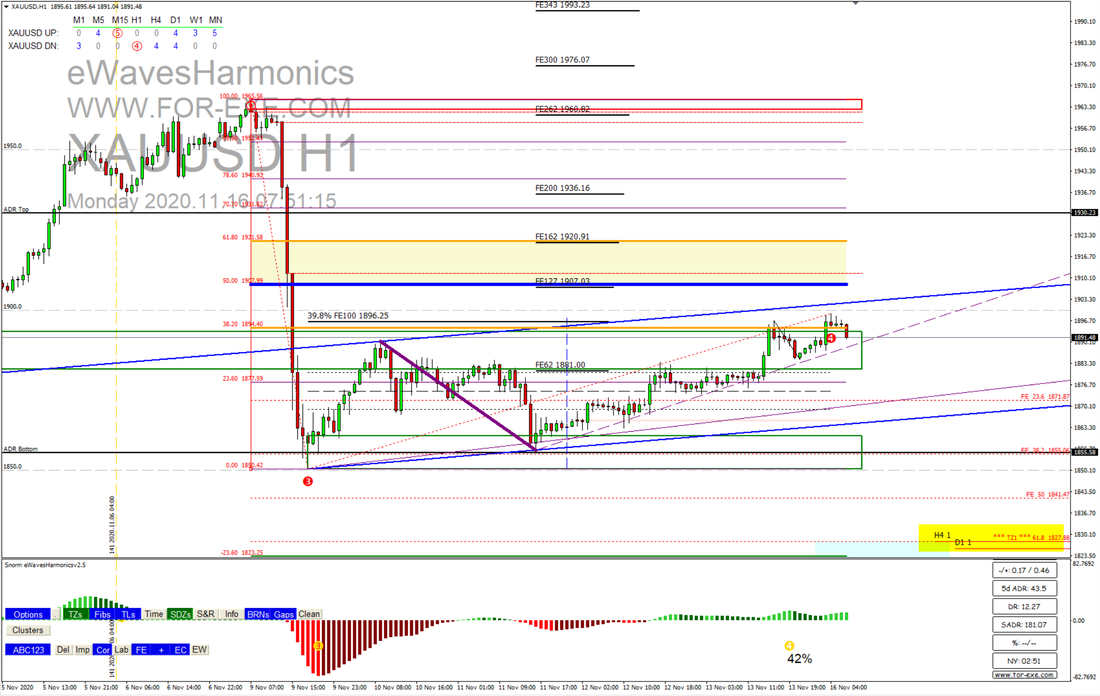 It's been far too long since my last post - moving to a new country leaves little time for such things but most of the personal tasks have been taken care of now; we just need to move into our new 'forever' home by the sea next month. Despite my international move, there will always be time for trading and this month has delivered some terrific trades on DAX and DOW, following the announcement of the COVID vaccine trials. DOW has made a new all time high, despite the economic doom-and-gloom and ever-increasing deaths from the virus; too sad for words. Mr Biden seems to have won the US elections (the fat lady has yet to sing on that one, so I say 'seems' until Mr Trump concedes) for which the indices also reacted well. The Euro is looking strong; the Dollar looks due for a correction; the pound is bouncing around clutching on to fading hopes of a trade deal with Europe. With good news for the indices often comes bad times for the safe-haven gold. Whilst DOW shot up on the vaccine news, gold crashed. as can be seen in the above and below charts. 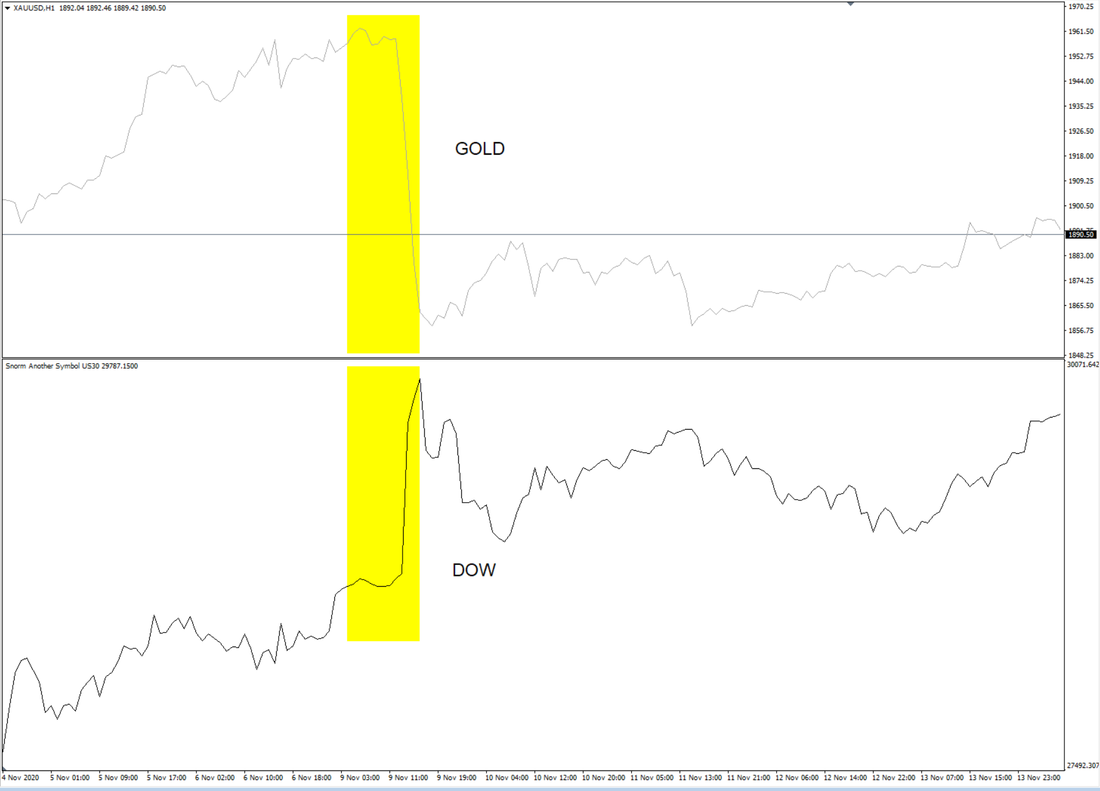 It would be reasonable to expect a second leg down from here (although we have yet to see the second leg down that everyone was expecting on the indices for this year's PA). Using eWH and the ABC123 indi (ref the first chart) , we can see that gold has done an ABC FE100 42% correction. Looking below we have an area of confluence for Target Zone 1, so if the most recent high holds and we get the secondary TLB, that's the area that I'll be looking to. Anything can happen, of course, but for now it's looking like another second leg down to the TZ1 or even the TZ2 would be the most likely outcome.
|
Archives
April 2024
|
 RSS Feed
|
Website design by Snorm
|