 ATM has now been upgraded to cater for the USA FIFO rules, where the first trade opened has to be the first trade closed. This will only be useful for our friends in America using in-country brokers. Thanks to Greg for bringing the problem to my attention and testing the changes. This short video explains more ...
0 Comments
 In case you missed the email or Facebook updates, we had quite a disaster yesterday after our web-hosting company completely cocked-up their overnight migration. Not only did it kill this website but it also destroyed the licence manager for the most important programs.
I'm very happy to report that all has now been resolved. The licence manager is on a completely different server, away from the unreliable hosting company, and seems to be working 100%. If you are having any problems with eWH / ATM / News Trader reporting 'Bad Agent', please run the installation program from the appropriate page. Drop me an email if you're still having issues and I'll reply as quickly as possible - I'm on standby. 1000 apologies for the inconvenience caused by those web-hosting idiots. 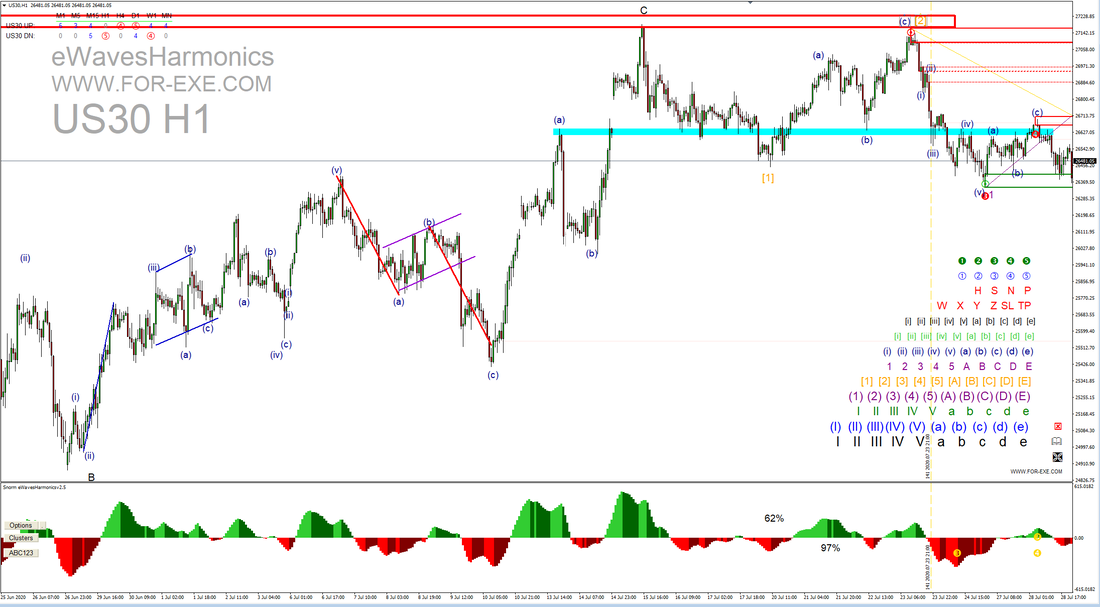 I had a request from Kumar, during the week ...
"Thanks for the Elliot Wave labels for Mt4. They are awesome. Could you pls enable option to move the main X? It is always on the right side bottom corner and it becomes difficult to use labels after clicking on the X and showing all the labels as the price is moving towards the right side of the screen. It would be helpful to move the main X to desired location. (left bottom corner, top left corner,etc)" That change has now been made. See this blog post for more information about the indi. Go to the eWaveHarmonics page to download - still free :) 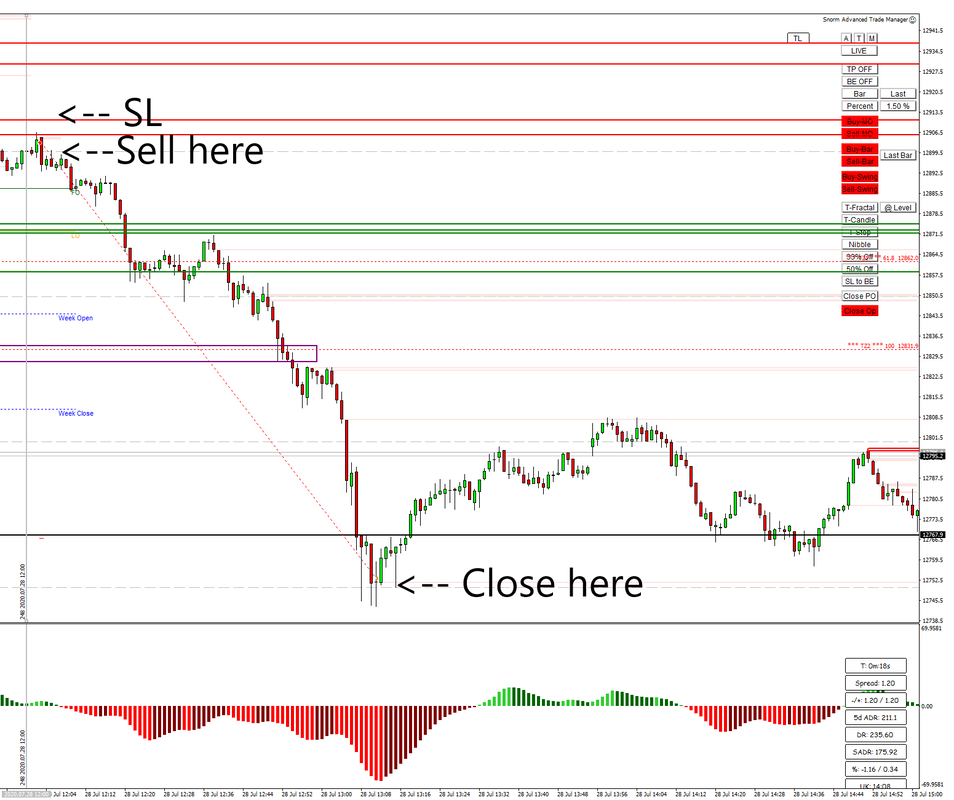 A special mention and big congratulations to Michal, from our Skype Trading Group, who, just yesterday, did his best M1 trade to date - making 21% profit in less than an hour. Incredible stuff!
How did he do it? He simply waited for a very low pip-risk entry (using a strong supply zone drawn by eWavesHarmonics) with an obvious price magnet for his target and some shrewd trade management. Patience - discipline - let the trade run. It's easy when you have the knowledge of price action, tools and discipline - all of which, Michal has mastered and demonstrates time and time again. Trading doesn't have to be complicated to be very profitable; nor do your charts need to be cluttered with useless indicators. Buy the dips, sell the rallies, rinse and repeat.  A trader friend recently asked me whether or not I trade during August – the month where many of the northern hemisphere traders are supposed to be on holiday (less likely during these strange times of Covid-19 lockdowns) and, according to rumour, it’s supposed to be the quietest month for trading. I treat August like any other month, for trading purposes: if the price action is good, on any given day, then I’ll trade it. The question, however, inspired some more statistical analysis, just to see if August really is as bad as many so-called ‘trading experts’ would have you believe. One simple approach is to just look at the monthly charts to see how the August bars compare to the rest of the year. A quick glance at a few charts suggested there was no noticeable difference. Visuals are one thing but nothing beats hard statistics; so I wrote a quick program to export the monthly data (using all available data from my broker – mostly back to 1997) for some of the main instruments, to CSV files. There are two values that seem like logical candidates for this exercise: the monthly price range (high-low) and the tick volume. If you’ve read my blog post ‘Tick Volume a Waste of Bits’, you’ll know that I have little regard for that data, it is however useful for the purposes of comparison. With the data averaged for each month, I was able to make the following summary table (click to enlarge): 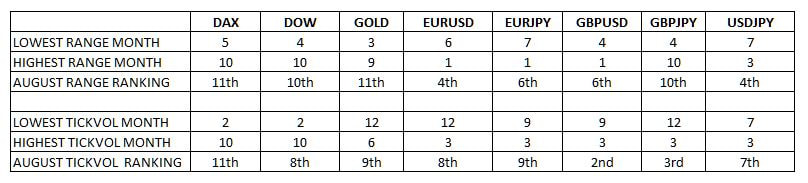 If we take the first column, for DAX, you can see that May (month five) had the lowest average price range and October (month ten) had the highest. August was 11th (with 12th being the highest). Similarly, using the average tick volume, February was the lowest and October was the highest. Again, August was second from the top. Therefore, it’s plain to see, August is definitely not a quiet month in terms of trading; quite the contrary. The data for the other instruments show that August is also just as good a month as most others, for trading, although the tick volume on GBPUSD and GBPJPY is quite low then.
I would have thought that December would rank lowest for most instruments but, surprisingly, that isn’t so – although we don’t need stats to tell us that trading between Christmas and New Year is a dumb idea. If you find yourself stuck at home this August, trade what the price action gives you. 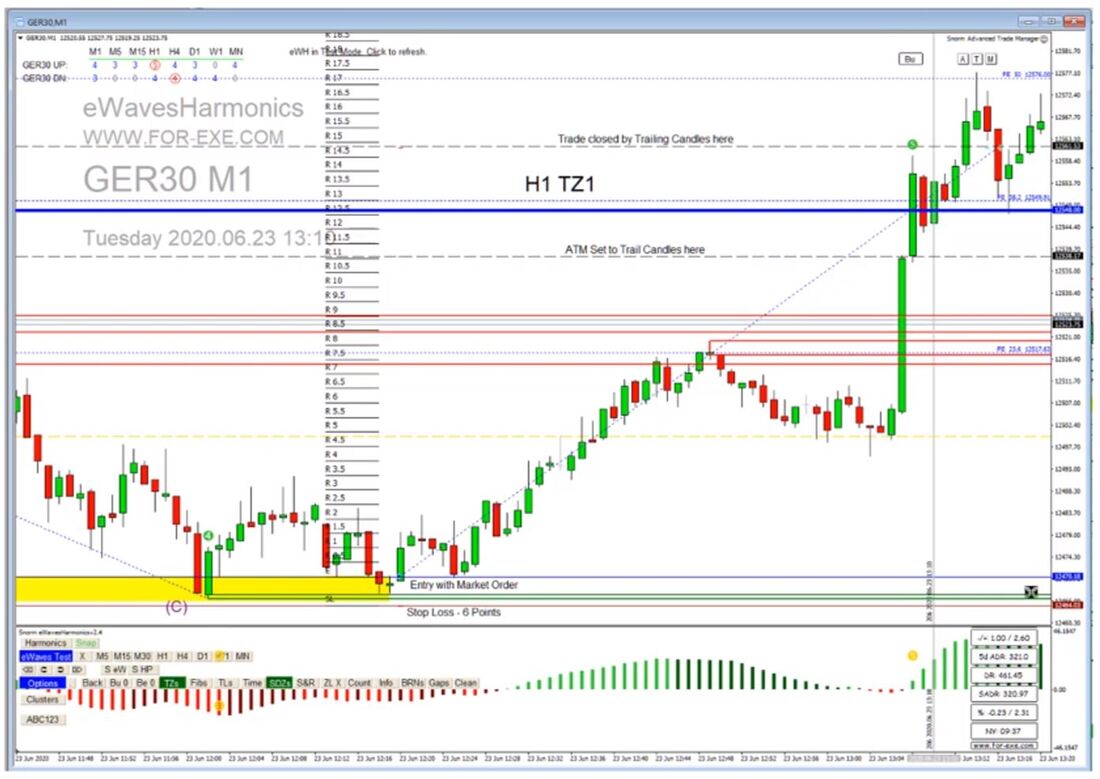 Another crazy week on the markets but, as traders, we like crazy markets. We've had some terrific RR trades already this week and it's only Wednesday morning. There was a more than 30R opportunity on DAX M1 this morning but, sadly (and due to poor SL management on my part), the max gained was just short of 10R - still not bad.
Just in case you have no idea what an 'R' is: it's an abbreviation for Risk:Reward. A 10R trade is 1 risk for 10 reward, which could be 1% risk for 10% gain; or 2% risk for 20% gain. Yesterday morning gave us a very simple, set-and-forget, 15R trade:, as you can see in the above picture. As I often get questions about how I do higher timeframe analysis and find the low risk trades, I made a video that talks about this trade in particular, looking at the pre-market analysis and the news events that were driving price up; along with how I identified the entry. This is available for viewing in the Trader Training Course.  eWavesHarmonics has had a simple, but important, upgrade this week, to allow for colour-coding and shading of the Fibonacci retrace levels. There is also an option to shade the TZ1 / TZ2 levels as well. I've made a 4 minute video to show some examples of how you could have traded the 50/62 level just this week, on #EURUSD #GBPUSD and a super example of a trade taken on #DAX, just this morning, in our Skype trading group - nearly everyone had a fantastic morning with this most simple of trades. 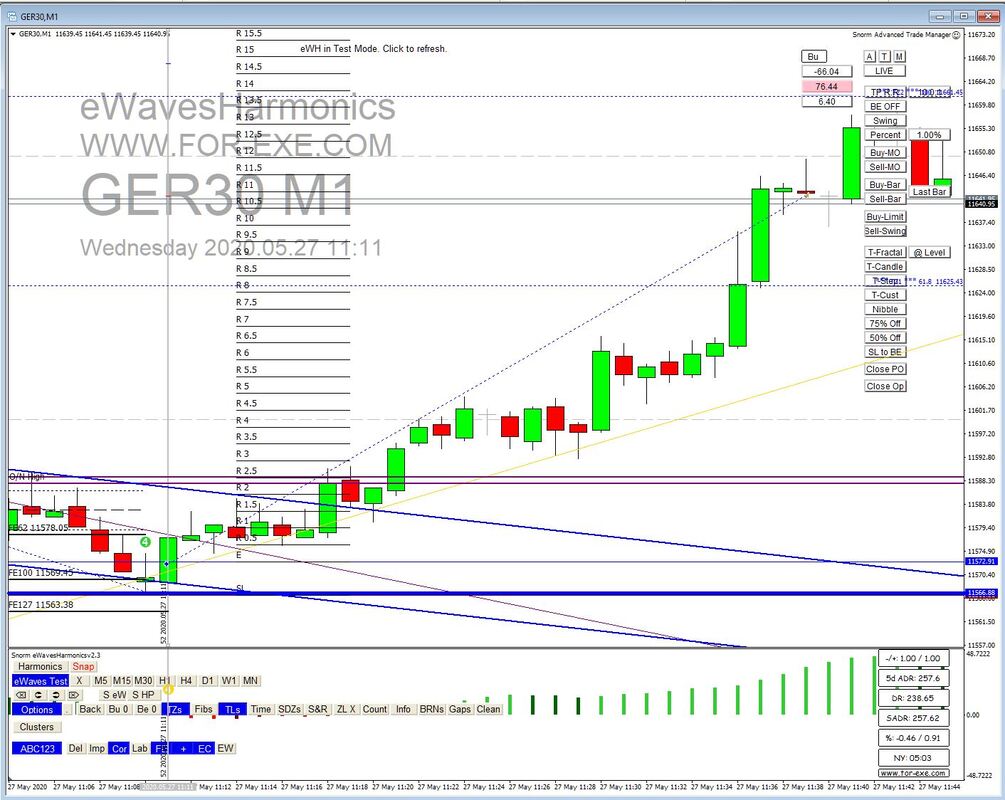 Just one more example to show the power of the simple ABC pattern, re the previous blog post on the subject. 11% in less than half an hour and most of us in the Skype group managed to grab some very nice R:R from that setup.
In this trade, we just waited for price to get to the FE100 level, shown by the ABC123 indi and used ATM to trail when price got to the eWH TZ1 level; eventually doing a manual lock at 11R. It's the simple stuff that works best :) 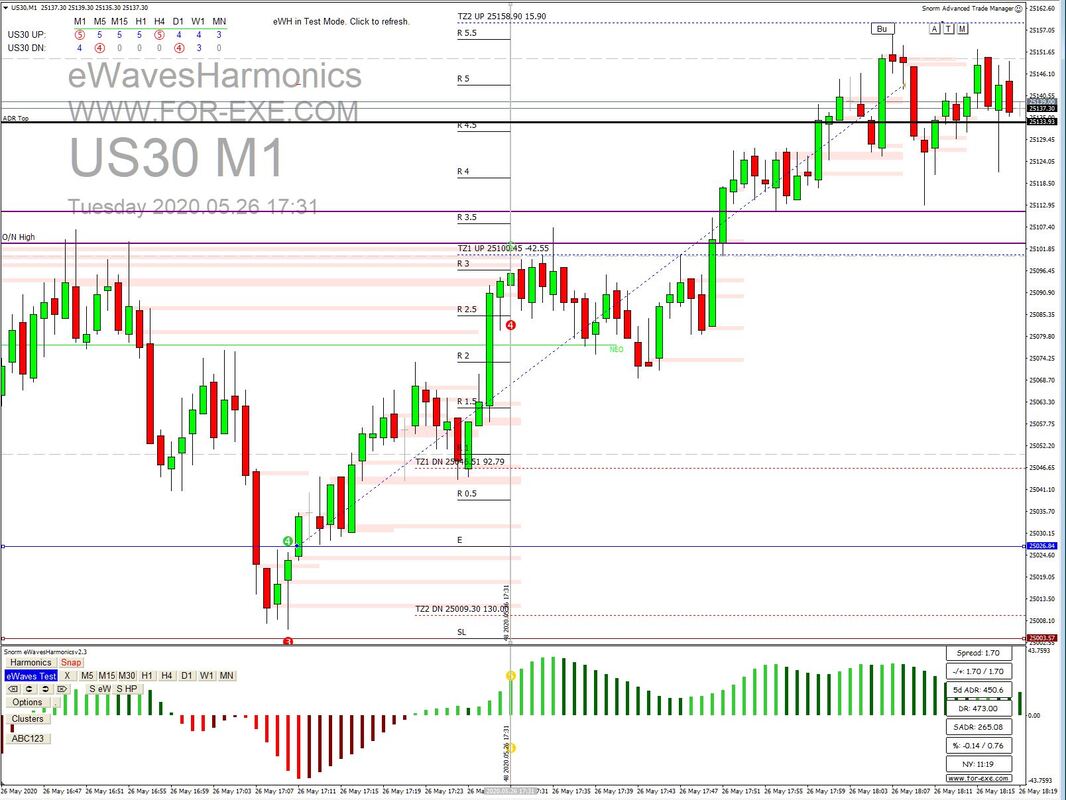 Following on from yesterday's blog post, here's an example of a simple ABC trade that some of us took in the Skype group. Risk 1 Reward 5 ... job done in less than an hour!
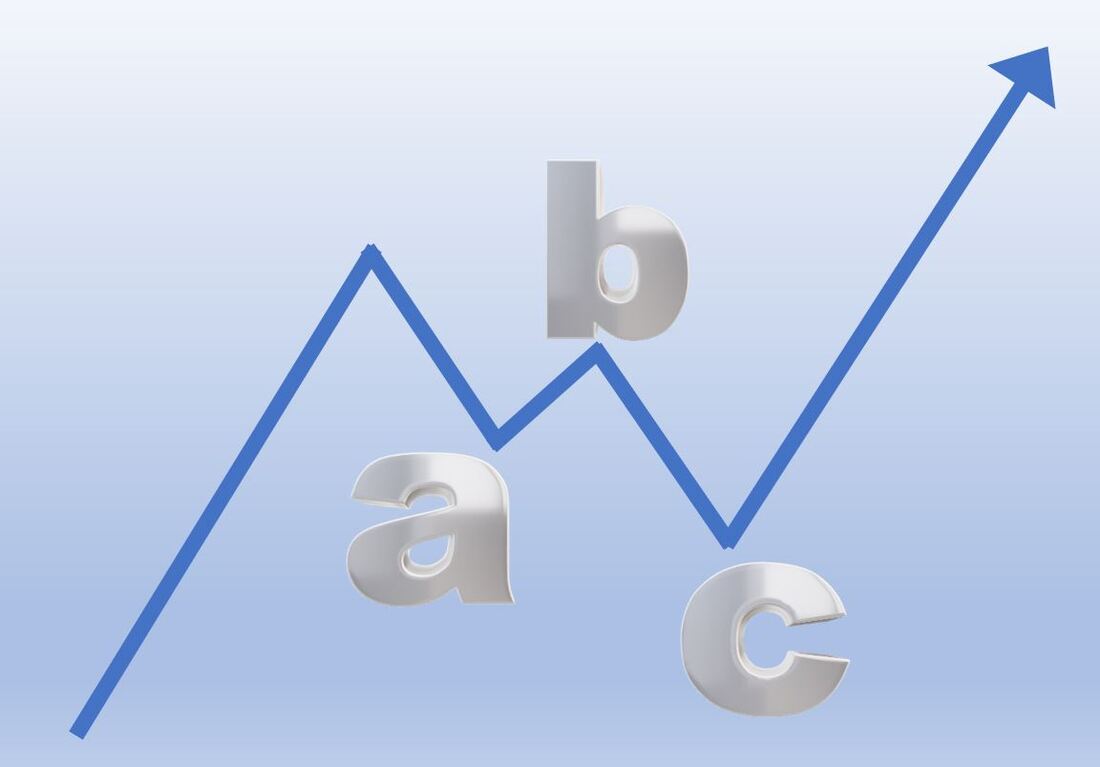 The simple ABC zigzag pattern is probably the easiest way to find a great risk-to-reward trade, by 'buying the dips and selling the rallies'. As an example, every day in our Skype group, since early April, we've been looking for DAX to make its way to the ABC FE100 level, with the top of that momentum gap providing terrific confluence. Here's the chart posted in early April ... you can see for yourself, on your own charts, where price has just got to :) 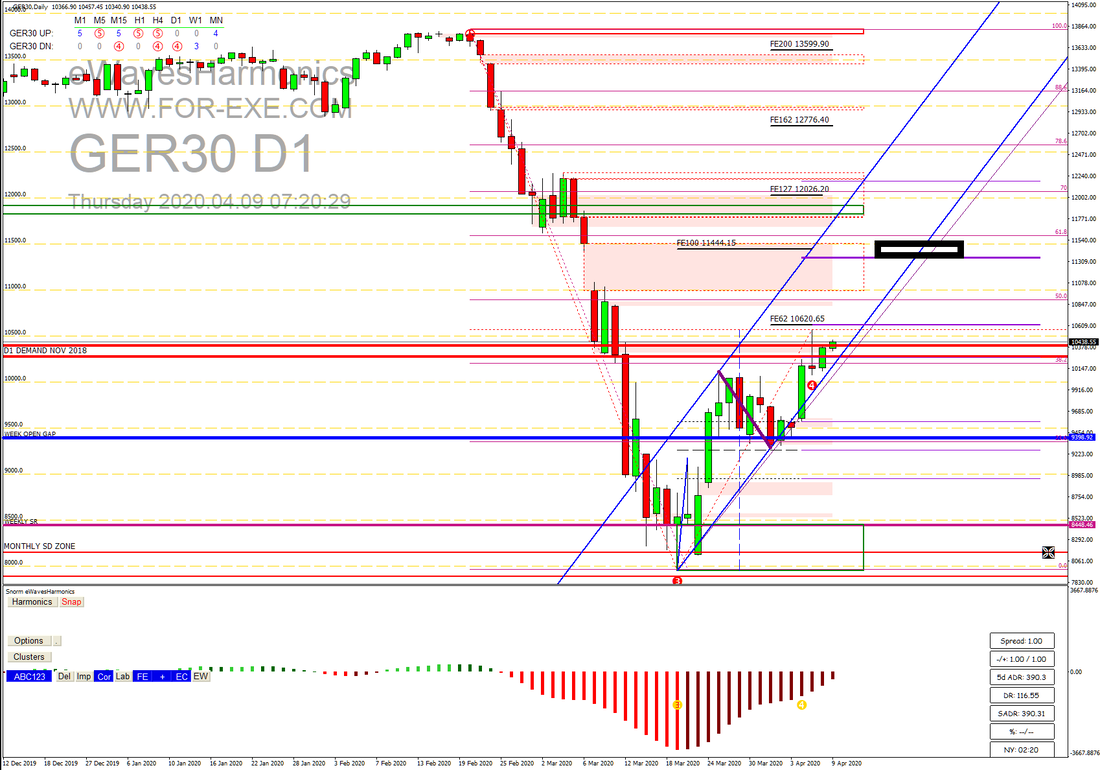 I've made a YouTube video with some examples of the pattern, showing how to identify them; explaining their specifications and how you can use the features of eWavesHarmonics plus the ABC123 indi to make trading them as simple as the pattern itself. Apart from recent ABC patterns found on GBPUSD and EURUSD, there is a 'trade of your life' example with Bitcoin. Hope you enjoy it ... |
Archives
April 2024
|
 RSS Feed
|
Website design by Snorm
|