www.for-exe.com
  • Home
  • eWavesHarmonics
  • INDICATORS
    • MT4 Indicators
    • MT4 Free Indicators & Scripts
    • eWaves v1.0 Manual
    • MT5 Indicators
  • Trade Tools
    • Advanced Trade Manager
    • Trade Copier
  • Trader Training
  • Harmonics
    • TheHarmonicIndi
    • TheHarmonicIndi Instructions
    • Harmonic Patterns
  • Trading Blog
  • Contact Us
  • Who is Snorm
  • Q&A
  • Trading Services
  • Useful Links
  • MT4 TIPS and TRICKS
  • Newsletter
  • MetaTrader Wingdings
  • Fibonacci Numbers
  • Privacy Policy
  • Terms of Use and Disclaimer

​From amateur to professional technical trader, in time that you own

27/1/2021

5 Comments

 
Picture
For the purposes of this exercise, put to the back of your mind everything that you have read about trading and technical analysis. Your best approach to technical analysis will be what you discover for yourself: it will be more meaningful to you, more enduring and easier to trade. If what you discover rings bells with what you’ve previously learned, then great! That reinforces things and makes them real to you.
 
Find some time that you can focus undisturbed, without phone calls or text messages, etc. This is allocated as “time that you own” and really is your own time in every sense.
 
Load a random chart (any timeframe will do) from your preferred instruments.   Remove all indicators, any grids or lines, so you only see time and price candlesticks (about 150 bars to the chart screen should do it).
 
Now go to the start of your chart history, and begin the process by scrolling through, one bar at a time, from history to today and allowing a reasonable amount of time for each bar
  1. Study the movement of all the visible candles on your screen to see what story they might be telling. Does the overall move look bullish or bearish, or perhaps range-bound? Observe how each of the waves look, identifying which are impulsive or corrective. When you’ve finished, move on to the next part. That should take a while, study the flows and imagine your thought process, as a seasoned pro-trader, what you would have been seeing, at the end of each wave. Do you notice some price levels acting as support or resistance? If so, mark the areas using your platform’s drawing tools. Perhaps you can see price moving in channels. Count how many bars there are in corrective swings compared to the same distance moved in the previous impulsive swing (that’s usually a good indicator that a move is more corrective than impulsive and can also be used to see divergence).
  2. Look at the ‘new’ candle, on the right-most part of your screen (as if it is the very latest one in present time) and study the relationship between the open, close, high and low. What story, about the time in which it took to form, does the candle tell you? Don’t move on until you’ve got that story in your mind.
  3. Study how the most recent candle relates to the previous candle, comparing the open, close, high and low values of the two.
  4. Then do the same for the above two candles, in relation to the next oldest candle, so you are comparing the most recent three together, establishing how they relate. How do the last three candles fit in with the most recent swing? Do they look like they might be ending the swing, continuing it or perhaps just consolidating, along with some other recent candles?
  5. If something crops up, as an ‘AHA’ moment, from your own studies or perhaps what you have learned in the past, make some notes about it.
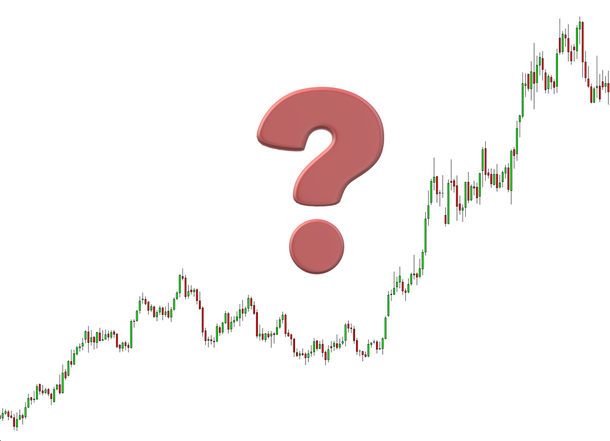
  6. Before you complete the exercise, write down whether you think price will move higher or lower, within the next (as yet unseen) 30 bars, and where price might go to – feel free to use the standard Fibonacci tools.
When you feel like you’ve really studied the visible bars, you can move your chart forward by one bar and repeat steps 2 to 5, with some of step 1 when there are about another 30 bars visible. Compare the revealed bars to your prediction, from point 6 and give yourself a point for every time you get it right.
 
This exercise is obviously all about reading price action – really reading it.  When you become competent at it and can start predicting where price will go to, using no indicators and just price bars and previous levels, along with some Fib’ tools, you’re becoming a good technical analyst and well on the road to becoming a professional trader.  The hard part though, after mastering the reading of price action, is to master yourself – but that’s another story. 
 
Most of you will have already done something like the above exercise; perhaps whilst testing every indicator and combination of indicators that you can fit on to your chart.  It will be so much more rewarding when you can analyse naked charts and make your own predictions from what the history of price has told you.
 
You do not need any indicators to be able to trade. eWavesHarmonics just removes a lot of the manual process that you should be doing yourself and helps to remind you of what is important, where the key levels are and where price might go to. Nothing will ever beat what the human brain can interpret from reading price action; especially the brain of a seasoned trader who has studied decades of price action, from back-testing as per the above exercise and live trading.  

The Trader Training Course teaches how to read price action if you need some help along the way but see what you can find for yourself.
 

5 Comments
Jozef Krutek
27/1/2021 02:05:01 pm

Perfect article Steve. Thanks

Reply
Steve
27/1/2021 03:49:23 pm

Glad you liked it Jo :)

Reply
Ray
16/4/2021 08:45:07 am

had aha moment just reading psot this is perfect thingto do at any stage of your pathway, i get why it can be sooo vaulable cheers Steve

Piggy

Reply
Steve
16/4/2021 09:07:44 am

really happy that you enjoyed my bla, Ray :)

Reply
codybecth link
24/5/2022 06:01:49 pm

Great Article! Thank you for sharing this is a very informative post, and looking forward to the latest one

Reply

Your comment will be posted after it is approved.


Leave a Reply.

    Subscribe to Newsletter
    Picture
    ​​Available on Amazon Kindle
    ​and Google Books

    Archives

    March 2025
    February 2025
    December 2024
    November 2024
    September 2024
    July 2024
    May 2024
    April 2024
    February 2024
    January 2024
    December 2023
    October 2023
    August 2023
    July 2023
    May 2023
    April 2023
    March 2023
    February 2023
    January 2023
    December 2022
    October 2022
    September 2022
    August 2022
    July 2022
    June 2022
    May 2022
    March 2022
    February 2022
    January 2022
    December 2021
    November 2021
    October 2021
    August 2021
    July 2021
    May 2021
    March 2021
    February 2021
    January 2021
    December 2020
    November 2020
    September 2020
    August 2020
    July 2020
    June 2020
    May 2020
    April 2020
    March 2020
    February 2020
    December 2019
    November 2019
    October 2019
    September 2019
    August 2019
    July 2019
    June 2019
    April 2019
    March 2019
    February 2019
    January 2019
    December 2018
    November 2018
    October 2018
    September 2018
    August 2018
    July 2018
    June 2018
    May 2018
    April 2018
    March 2018
    February 2018
    January 2018
    December 2017
    November 2017
    October 2017
    September 2017
    July 2017
    June 2017
    May 2017
    April 2017
    March 2017
    January 2017
    December 2016
    November 2016
    October 2016
    September 2016
    August 2016
    July 2016
    June 2016
    May 2016
    April 2016
    March 2016
    February 2016
    January 2016
    December 2015
    November 2015
    October 2015
    August 2015
    May 2015
    April 2015
    March 2015
    February 2015
    January 2015
    December 2014
    November 2014
    October 2014
    August 2014
    July 2014
    June 2014
    May 2014
    April 2014
    February 2014
    January 2014
    December 2013
    November 2013
    October 2013
    September 2013

    RSS Feed

@snormtrader.bsky.social
We no longer use Twitter / X - please follow us on BlueSky
Subscribe to Newsletter
  • Home
  • eWavesHarmonics
  • INDICATORS
    • MT4 Indicators
    • MT4 Free Indicators & Scripts
    • eWaves v1.0 Manual
    • MT5 Indicators
  • Trade Tools
    • Advanced Trade Manager
    • Trade Copier
  • Trader Training
  • Harmonics
    • TheHarmonicIndi
    • TheHarmonicIndi Instructions
    • Harmonic Patterns
  • Trading Blog
  • Contact Us
  • Who is Snorm
  • Q&A
  • Trading Services
  • Useful Links
  • MT4 TIPS and TRICKS
  • Newsletter
  • MetaTrader Wingdings
  • Fibonacci Numbers
  • Privacy Policy
  • Terms of Use and Disclaimer