|
Bitcoin has been in a deep correction since the incredible bull run that ended on 26th June, up near 14k. The recent criminal investigations and realisation that transactions might not be as secret as some shady dark-web characters had hoped, has done nothing to help the BTC bulls' optimism.
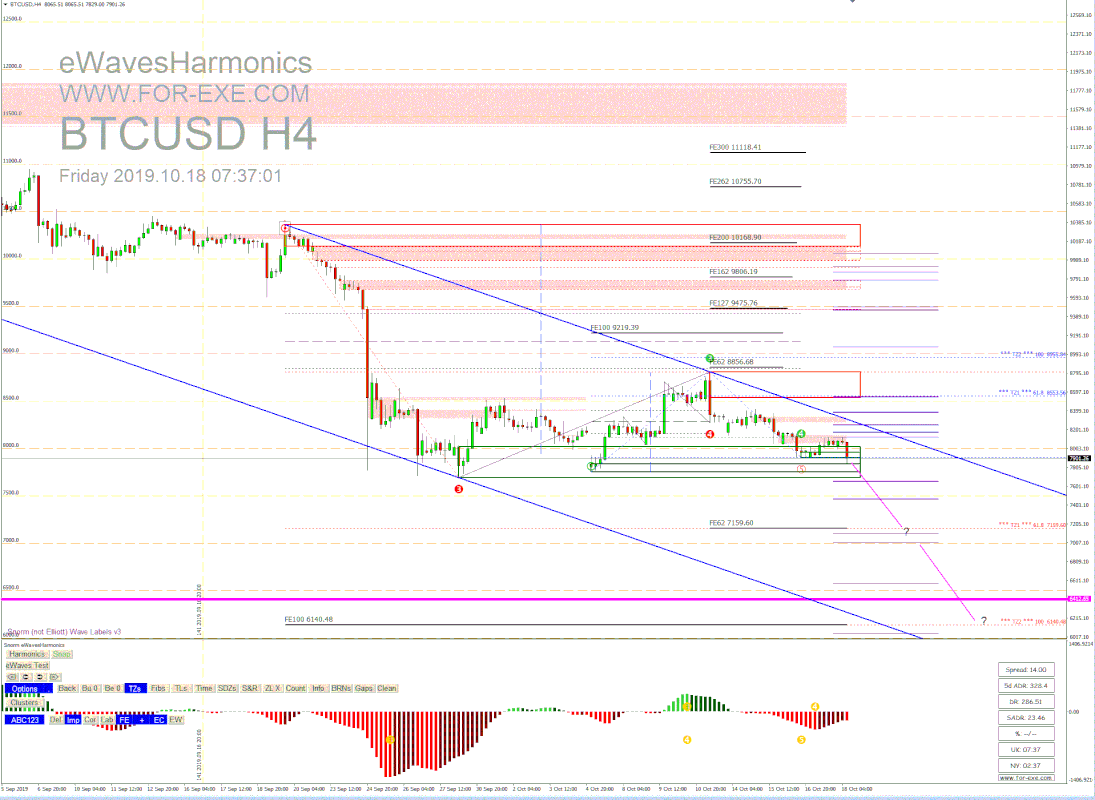
Just for a change, I thought it would be good to see where it might head to next, using some of the features of eWavesHarmonics (eWH). The red 3 shows where the last impulsive bear move ended and subsequently corrected - giving us a mini demand zone, shown by the green rectangle. This is obviously a key support level for us now - you don't need to be a trading wizard to work that one out. The important thing is what price does next with that level. If it breaks, as I suspect it will, we'll be looking at the TZ1 and TZ2 levels, auto-plotted by eWH. The Fibonacci cluster-clusters (purple horizontal lines) provided resistance yesterday and give price some direction below, should price break the support. Needless to say, these levels will be good to watch, above and below where price is currently at. Another level worth watching for is 6400-ish (thick magenta line) - the gap formed back in May that was never properly closed. There aren't too many reasons to be bullish on BTC at the moment but let's see if the green 3 forms a strong base, or breaks, in the coming days.
0 Comments
Your comment will be posted after it is approved.
Leave a Reply. |
Archives
May 2024
|
|
Website design by Snorm
|


 RSS Feed