|
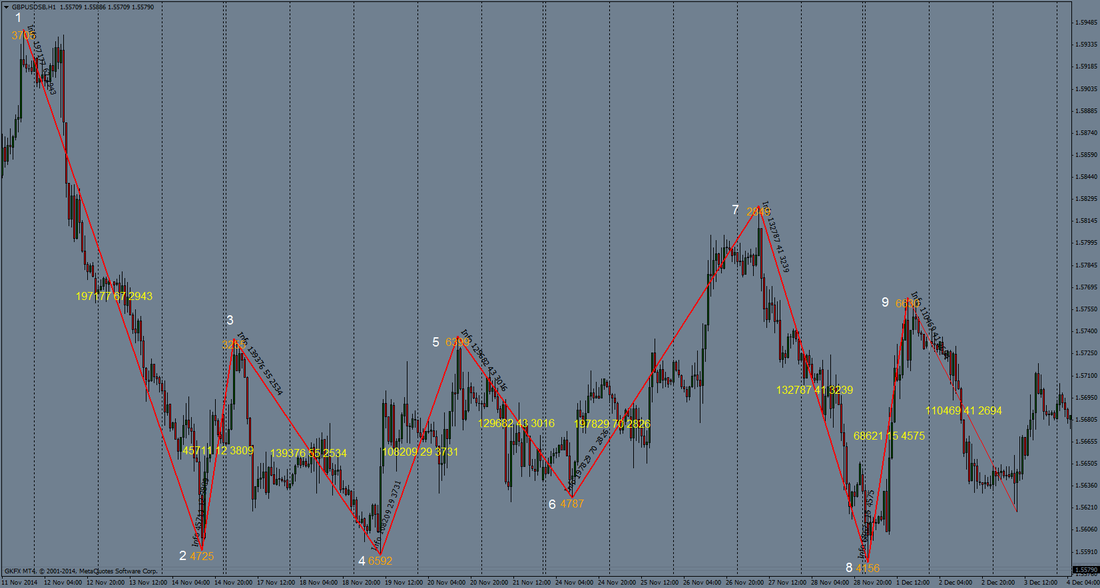
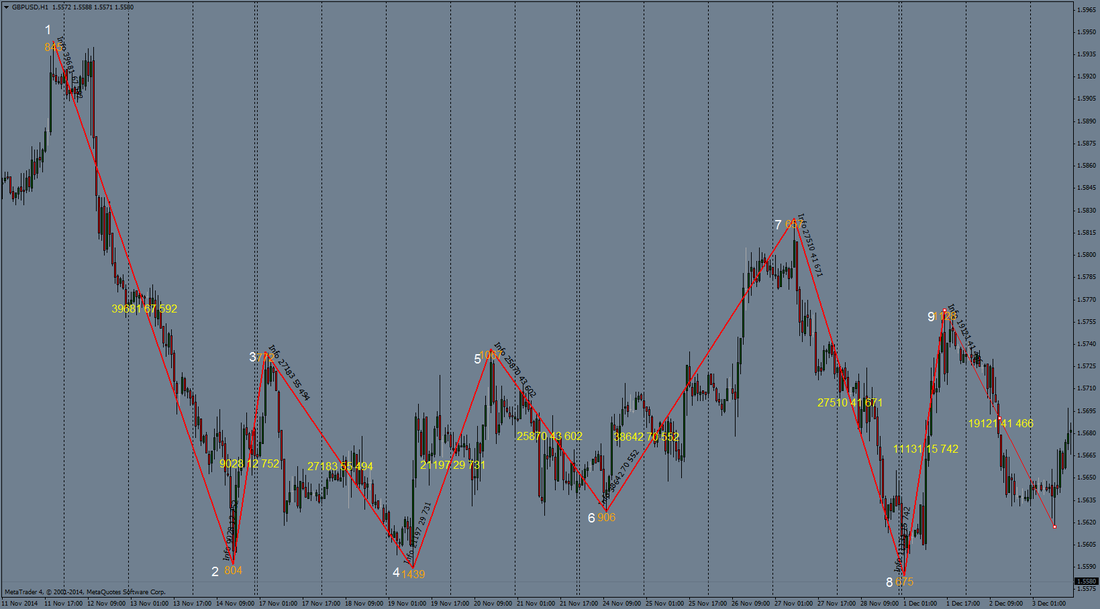
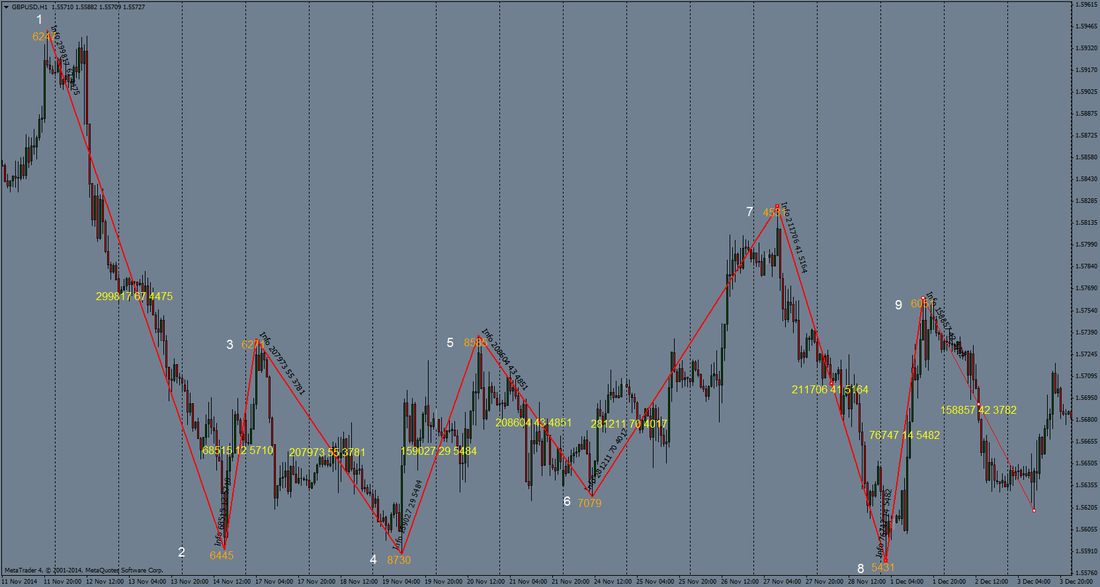
Since the spot forex market is not traded through a central point of exchange, getting real volume information is no easy task; in fact, it is impossible to obtain the total dollar amount of transactions for any currency pair. We can get volume information for options and futures. We can get volume data from some spot forex brokers. It is even possible to get aggregate volume information from a number of sources but the real total volume just isn’t available to us. So those clever people at MetaQuotes came up with ‘Tick Volume’ for MetaTrader (though they just call it ‘volume’) – something that many will tell you is as good as the real thing but is it? Tick Volume represents the fluctuation of quoted prices. The theory is that price will change whenever there are transactions and the more transaction there are, the more price will change, the greater the apparent ‘volume’. This is very different to the volume information that you would get from equities or futures. For many years I have heard from traders, or read in forums, about how important volume is for making informed trading decisions. There are countless threads, websites and (often very expensive) courses on volume-spread-analysis. There is no doubt about the worth of true volume information but I thought I’d see for myself how useful the MetaTrader volume really is and whether it could be used as an aid for trading spot forex: the results were not what I expected and hence the reason for this blog post. We know that the volume information would be different across the brokers, as they provide the prices and the tick data, but the key thing for any trader is that the relative volume data should be very similar, if not the same, across all the brokers; otherwise volume-traders would trade very differently according to the broker they use. I wrote a simple little indicator to test this out – something to display volume data of a chosen bar and of a range when a trend line is drawn. The pictures below (click on each one to make bigger) shows this indicator in action, on recent GU H1 charts, from GKFX, Activtrades and Alpari. The orange numbers show the volume of the bar from where the trend line was drawn; the yellow numbers show total volume, number of bars and average volume of the range.
The tables below show the data from each of the charts – I hope it makes sense (I entered the numbers manually so let me know if you spot any errors). 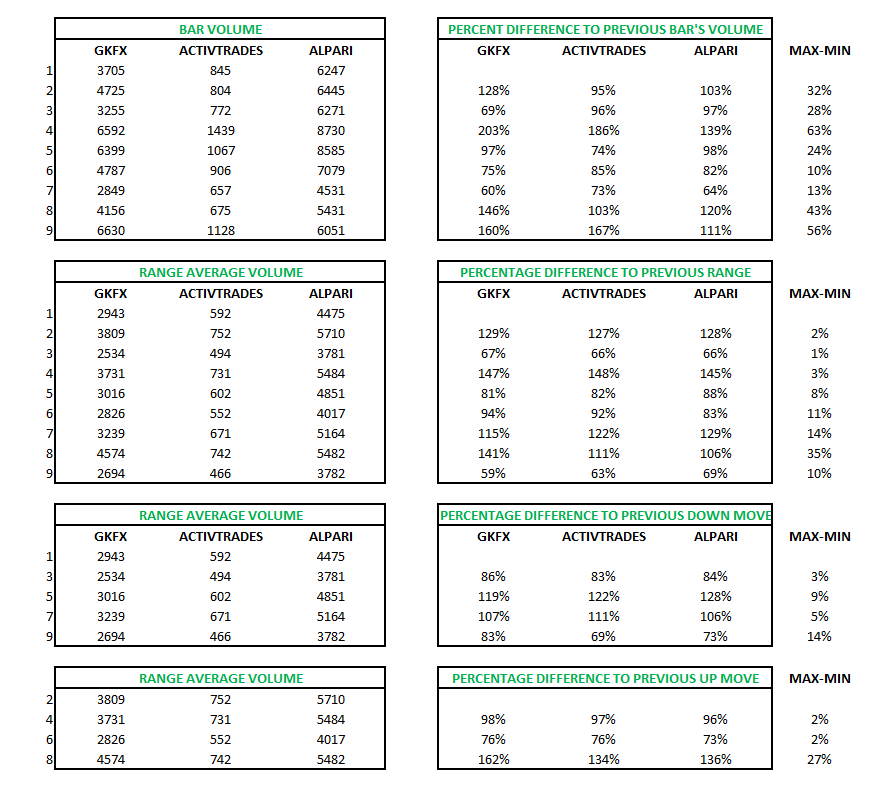 The table on the top right shows the percentage difference between individual bar volumes on each chart, so for example, bar 2 on GKFX has 128% more volume than bar 1; bar 3 has 69% of bar 2, etc. We would expect that to be roughly the same across all the brokers but not so … bar 2 has only 95% of the bar 1 volume on Activtrades and 103% on Alpari. How can bars on an hourly chart have such a different amount of ‘volume’ data across the brokers? The Max-Min column shows the largest difference between the brokers – up to 63%.
The average volume data of the selected moves was also substantial – up to 35%. Same direction move comparisons had a difference of up to 27% across the brokers. Conclusion: I really can’t see that tick volume is of any use for making informed trading decisions from relative data (bar-to-bar or range-to-range) when there is such a variance across the brokers; I would go as far to say it’s a waste of Bits. I would however love to meet anyone who thinks otherwise and is consistently profitable from trading with the MetaTrader 'volume' data.
4 Comments
Hi Steve,
Steve
8/12/2014 12:11:53 am
Many thanks Erron. I've never bothered with tick volume either (though use to use normal volume many moons ago when I traded equities). I wanted to present the facts, as I saw them, with this article as there is so much conflicting information out there in web-world. Now I have very good reason to continue trading without the tick volume brain-clutter :)
David
21/11/2015 08:41:06 am
It is kind of obvious that tick data is not reliable for anything and has no connection to the real volume. But what exactly it really is? I think it could be useful to know nevertheless.
David
21/11/2015 08:42:47 am
Well, I mean we know that tick is generated when price is changed, but what does cause that change? Your comment will be posted after it is approved.
Leave a Reply. |
Archives
May 2024
|
 RSS Feed
|
Website design by Snorm
|