|
Many Forex trading system sellers love to quote probabilities and statistics but there are usually two main problems: -
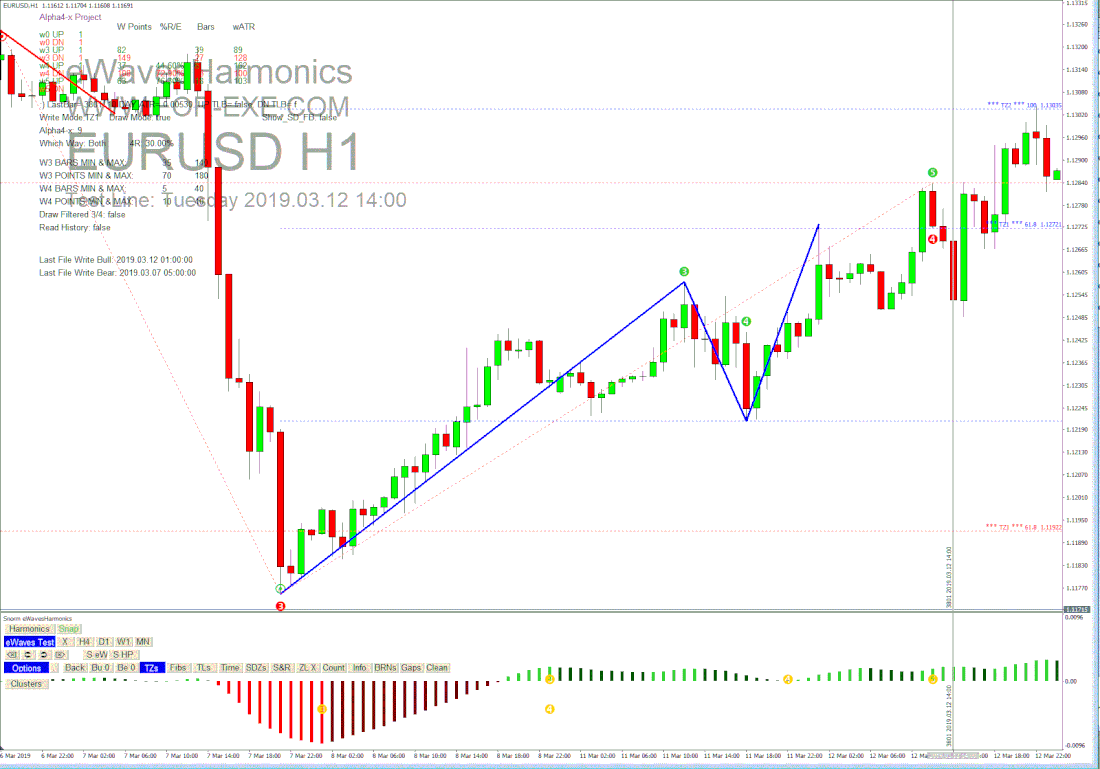
Here are some real statistics, from eWavesHarmonics (eWH), that I’ve just shared with my friends in the Skype Trading Group. It’s an exercise that I did a few years back that seemed worthy of being repeated with more recent data. Before we get into the numbers, I’ll just define some key points. eWH, like eWaves v1.0 shows: an impulsive wave labelled ‘3’; a corrective wave labelled ‘4’; another impulsive wave, with divergence, labelled ‘5’ The wave labels often align perfectly with Elliott Wave counts but not all the time – that’s an important point to note. From the waves 3 and 4, eWH automatically projects target zones (TZ) 1 and 2, using Fibonacci expansion levels. Now onto the statistics … the analysis, gleaned from several instruments over all available data with my broker, looks at how often TZ1 and TZ2 levels are hit, when a W5 has been identified. The W5 could be a truncated 5, where price has just corrected to the 3 level, long before TZ1 or TZ2 has been hit. I hope that makes sense. We are particularly interested in the percentage of times the TZ levels are subsequently hit and how much the W4 needs to retrace the W3. As we’re not talking Elliott Wave definitions, all of the time, the depth of retrace could often be significantly more than what you’d expect from a regular wave 3 and 4. This information is designed for traders with eWH but can also be used by those with eWaves v1.0; although it should be noted that eWH uses some different algorithms for defining the start of waves and thus the TZ levels – they will often be the same though. . Let’s start with Bitcoin 15-minute chart, from 31st May 2019 to 18th Oct 2019.
Anything with more than a 50% probability is a great thing, in trading, particularly where the R:R is greater than 2. So, the chances of a W5 going on to hit TZ1 is 52% - that should tell you that it’s a good thing to lock profits, when a 5 has been identified, after you’ve entered on the W4 – e.g. on a TLB, with a view to price going up to TZ1. Once price has hit the TZ1, you can lock profits again, knowing there is a 37% probability of price going on to hit TZ2. The average max R:R of 1: 11.37 is fantastic but, I hope, you’ll be wanting to know how that is calculated. I’ve assumed a perfect W4 entry – getting in on the open of the bar after that which formed the W4 extremum. Seldom will traders be able to enter with such finesse but it’s certainly not impossible, e.g. a clear rejection candle at supply/demand or support/resistance. I’ve then looked at how far price travels, over the next 1000 bars, without breaking the extremum of the W4. For most traders, the average R:R will be significantly less than 11 but, of course, there will be trades that offer significantly more. The maximum that I found for Bitcoin was 142 – and much more on other instruments (spread not factored). Needless to say, you would need to be a bit of a trading wizard to get that but, again, it’s certainly not impossible. Now, with the stats fully explained, let’s look at some other instruments and timeframes. Remember, anything over 50% is great but, for TZ2, the R:R will be much greater than TZ1s, so we can accept a lower percentage hit rate. Gold M5 29/7/19 to 18/10/19 Number of W5s found: 174 Number of TZ1 hits: 88 (51%) Number of TZ2 hits: 53 (30%) Average Max RR (for 1000bars): 7.65 DOW M5 20/12/18 to 18/10/19 Number of W5s found: 603 Number of TZ1 hits: 381 (63%) Number of TZ2 hits: 258 (43%) Average Max RR (for 1000bars): 10.45 USDJPY H1 22/2/19 to 18/10/19 Number of W5s found: 47 Number of TZ1 hits: 31 (66%) Number of TZ2 hits: 20 (43%) Average Max RR (for 1000bars): 10.30 DAX M5 6/5/19 to 18/10/19 Number of W5s found: 329 Number of TZ1 hits: 198 (60%) Number of TZ2 hits: 135 (41%) Average Max RR (for 1000bars): 9.88 EURUSD H4 2/3/10 to 18/10/19 Number of W5s found: 117 Number of TZ1 hits: 74 (63%) Number of TZ2 hits: 39 (33%) Average Max RR (for 1000bars): 8.60 GBPUSD H1 20/9/17 to 18/10/19 Number of W5s found: 122 Number of TZ1 hits: 74 (61%) Number of TZ2 hits: 47 (39%) Average Max RR (for 1000bars): 7.01 What’s the most common percentage retrace, that W4 does of W3 before forming the W5, you might well be asking. I can answer that for you … With all the data, from the above instruments and timeframes aggregated, the results are: - W4% retrace Occurrence 10-20% 2% 20-30% 8% 30-40% 14% 40-50% 15% 50-60% 17% 60-70% 14% 70-80% 12% 80-90% 9% 90-100% 7% Probably no surprises there: between 30 and 80% is a good W4 retrace of W3, with 50 to 60% being the higher probability. You might well have a few more questions, if you’re still awake after reading this blog post, one of which is: how did you get these stats? That’s simple – I wrote an indicator that works with eWH in ‘test mode’ – whenever a W5 is identified, from the auto-scrolling, the code writes the values to a CSV file. I then created some pivot tables and extracted the data. It’s all above board and genuine, the original files have been shared with my friends in the Skype group. I have also done an analysis of the best times to look for W5s on DAX and DOW, but that’s for another day. Buy the dips and sell the rallies, is what we’re looking to do with eWH. When we do that, we target the 3 SD zones, first, then the TZ levels. When all is said and done, this is a very simple approach to trading, with – as the above results demonstrate – a reasonably high-probability of having a very successful trade. The art is being able to identify the possible end of a W4 – that is covered in the trading course.
2 Comments
Amaechi
21/10/2019 02:32:01 pm
Wow! Such stats. Nothing beats this for me. Thanks Steve. Waiting for your next article.
Reply
Steve
21/10/2019 02:40:34 pm
Thanks Amaechi - I'm glad you like the article :)
Reply
Your comment will be posted after it is approved.
Leave a Reply. |
Archives
May 2024
|
|
Website design by Snorm
|


 RSS Feed