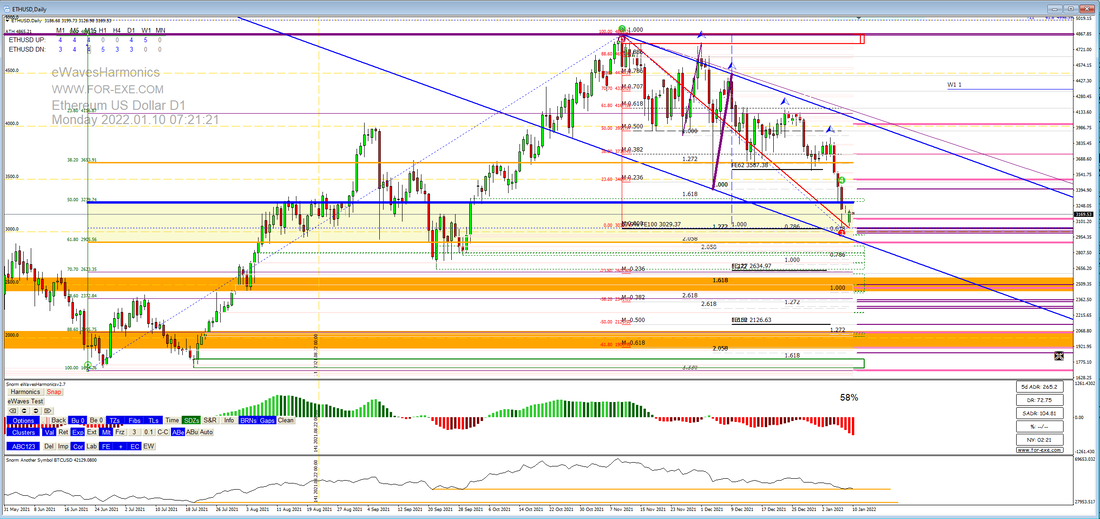
 Ethereum USD is in an interesting spot at the moment - looking very much like an ABC back to the 4. Thanks to Sergio, in our Skype Group, for pointing this one out on Friday,
The pink horizontal lines, to the right of the chart, are Fibonacci retracements clusters (using the Clusters tool that comes with eWavesHarmonics) going back to 2016 - they act as nice support zones. I've used the ABC123 indicator, for the corrective move, along with the Fib Expansion and Fib Multiplier (a new addition that's in testing and showing remarkable results) to project the price-magnet clusters: the purple horizontal lines. BTCUSD is in the bottom window - you can see how nicely correlated these instruments are and how BTC is also at support. So we have ABC FE100 back to the 4, price is in the 'golden zone' of the up wave - the 50/62 - and it's at the demand zone: several factors for confluence. Plus it looks like that's a possible small exhaustion gap to the cluster-cluster. If ETH (or indeed the BTC) breaks current support, we can look to the FE127, right at the end of the 4 of the up-move, then the orange zones but, at least for now, this is looking like a nice discounted price to add some Ethereum to your portfolio.
0 Comments
Your comment will be posted after it is approved.
Leave a Reply. |

Archives
May 2024
|
 RSS Feed
|
Website design by Snorm
|