www.for-exe.com
  • Home
  • eWavesHarmonics
  • INDICATORS
    • MT4 Indicators
    • MT4 Free Indicators & Scripts
    • eWaves v1.0 Manual
    • MT5 Indicators
  • Trade Tools
    • Advanced Trade Manager
    • Advanced News Trader
    • Trade Copier
  • Trader Training
  • Harmonics
    • TheHarmonicIndi
    • TheHarmonicIndi Instructions
    • Harmonic Chart Pictures
    • Harmonic Patterns
  • Trading Blog
  • Contact Us
  • Who is Snorm
  • Q&A
  • Trading Services
  • Useful Links
  • MT4 TIPS and TRICKS
  • Newsletter
  • MetaTrader Wingdings
  • Fibonacci Numbers
  • Privacy Policy
  • Terms of Use and Disclaimer

Daily Percentage Moves

30/8/2016

2 Comments

 
When you listen to the news, be it national TV or specialist channels such as Bloomberg, you will usually hear that a particular instrument - be it an index, commodity, forex pair, etc. – has gone up or down by x percent on the day. Percentage gains and losses are easy to understand whereas pips can be relatively meaningless, if you don’t know the price of the instrument and what its typical daily movements are.
​
So it’s rather surprising that I never hear any retail traders refer to percentage moves on the day. The percent levels probably act as well as pivot levels in terms of support and resistance.  A gain or loss of just half or one percent, from the opening price, can be quite significant and prove to be the ceiling or floor of that day’s move. With the help of an indicator to plot the percentage levels and some basic candle analysis, a trader can find some nice trading opportunities, as this example shows (a random period on Dax M15 with just some of the possible quick trades).
Picture
​
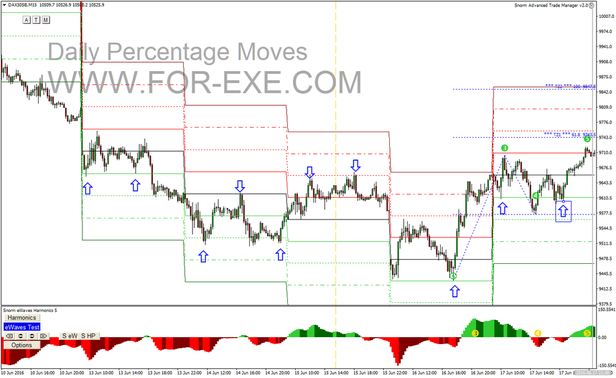
​Just for the fun of it, I thought I’d see how fib-based percentage moves might look.  Here is a period on GBPUSD with 38.6, 50, 61.8 and 78.6 percent levels.  
Picture

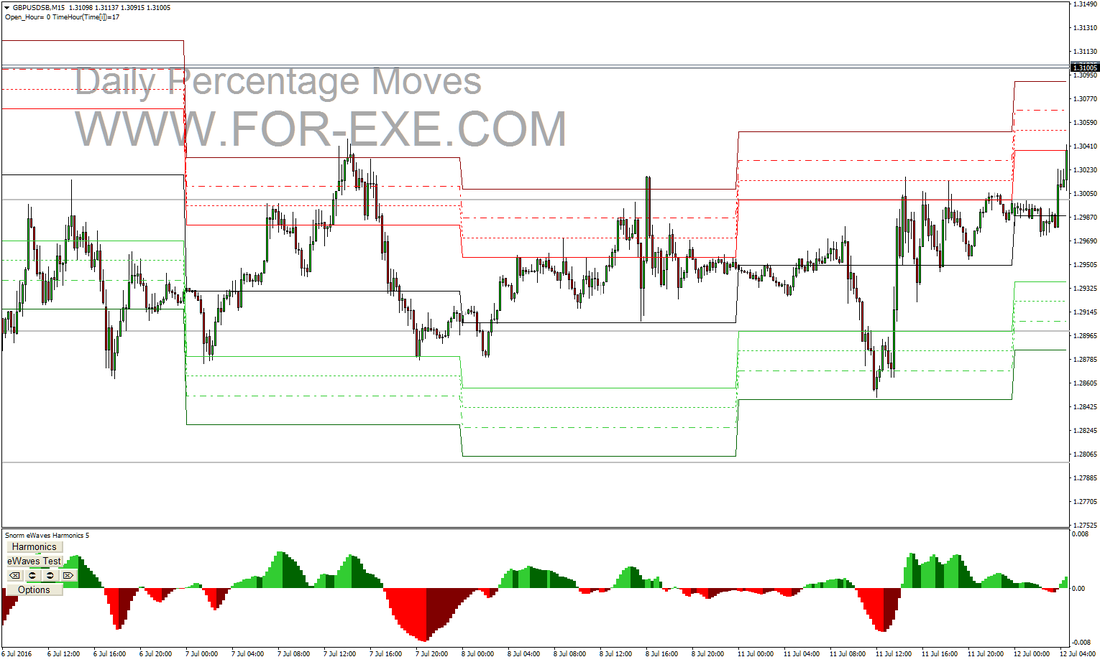
It’s easy to check what the typical daily percentage moves are on any instrument, using the ‘History Centre’ in MetaTrader. Select the instrument and daily timeframe; ‘export’ to a csv file; add your own excel calculations to get the percentage difference of high and low from the open. With the help of a pivot table you can quickly see, for example (using 1,555 bars), that 62% of the time, the high and low on the Dax is at least half a percent from the open. About 34% of the time, the high and low will be one percent or more. Only nine percent of the time there has been two percent or more gain but twelve percent of the time there has been a two or more percent drop.
 
You’re more than welcome to have a play with the percent level indicator – just download it from the Free Indicators tab.  This isn’t some magical indicator that will necessarily guarantee improved trading results but you might find it of some use.  It has the option to work with yesterday's close price, today’s open or the market open hour of your choosing.  You can of course customise the percent levels as you prefer.

The main thing is that percentage moves on any instrument are something to be mindful of. Would you go long on the Dax when it has already moved one percent up on the day, knowing that, according to history, there is only a 1 in 3 chance of price going higher?
2 Comments
Spyros
30/8/2016 07:15:57 pm

Nice info as always Steve.

Reply
Steve
30/8/2016 07:38:11 pm

χάρη Σπύρος

Reply

Your comment will be posted after it is approved.


Leave a Reply.

    Subscribe to Newsletter

    Archives

    March 2023
    February 2023
    January 2023
    December 2022
    October 2022
    September 2022
    August 2022
    July 2022
    June 2022
    May 2022
    March 2022
    February 2022
    January 2022
    December 2021
    November 2021
    October 2021
    August 2021
    July 2021
    May 2021
    March 2021
    February 2021
    January 2021
    December 2020
    November 2020
    September 2020
    August 2020
    July 2020
    June 2020
    May 2020
    April 2020
    March 2020
    February 2020
    December 2019
    November 2019
    October 2019
    September 2019
    August 2019
    July 2019
    June 2019
    April 2019
    March 2019
    February 2019
    January 2019
    December 2018
    November 2018
    October 2018
    September 2018
    August 2018
    July 2018
    June 2018
    May 2018
    April 2018
    March 2018
    February 2018
    January 2018
    December 2017
    November 2017
    October 2017
    September 2017
    July 2017
    June 2017
    May 2017
    April 2017
    March 2017
    January 2017
    December 2016
    November 2016
    October 2016
    September 2016
    August 2016
    July 2016
    June 2016
    May 2016
    April 2016
    March 2016
    February 2016
    January 2016
    December 2015
    November 2015
    October 2015
    August 2015
    May 2015
    April 2015
    March 2015
    February 2015
    January 2015
    December 2014
    November 2014
    October 2014
    August 2014
    July 2014
    June 2014
    May 2014
    April 2014
    February 2014
    January 2014
    December 2013
    November 2013
    October 2013
    September 2013

    RSS Feed

Website design by Snorm
Subscribe to Newsletter
  • Home
  • eWavesHarmonics
  • INDICATORS
    • MT4 Indicators
    • MT4 Free Indicators & Scripts
    • eWaves v1.0 Manual
    • MT5 Indicators
  • Trade Tools
    • Advanced Trade Manager
    • Advanced News Trader
    • Trade Copier
  • Trader Training
  • Harmonics
    • TheHarmonicIndi
    • TheHarmonicIndi Instructions
    • Harmonic Chart Pictures
    • Harmonic Patterns
  • Trading Blog
  • Contact Us
  • Who is Snorm
  • Q&A
  • Trading Services
  • Useful Links
  • MT4 TIPS and TRICKS
  • Newsletter
  • MetaTrader Wingdings
  • Fibonacci Numbers
  • Privacy Policy
  • Terms of Use and Disclaimer